| Summary Box
|
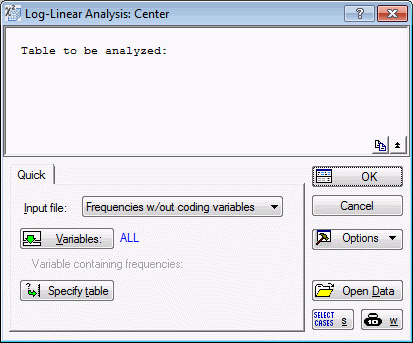
The Summary box at the top of the
Startup Panel displays a general summary of the analysis in progress.
Click the
Copy button to copy either the selected text (if text has been selected) in the Summary box or all of the text (if no text has been selected) to the Clipboard. Note that the copied text retains formatting information (such as font, color).
Click the
Contract/Expand button to
Contract or Expand the Summary box. When Contracted, you can see only one line of the Summary box text and can scroll through the text using the scroll bar. Note that when Contracted the text is scrolled so that the first non-blank line is at the top. When Expanded (the default setting), the entire Summary box is displayed.
|
| Input File
|
The Input file option contains three choices to specify the different types of data files that Log-Linear can process:
Raw Data,
Frequencies with coding variables, and
Frequencies w/out coding variables.
If Raw Data is selected, Statistica will compute the frequency table from the data. Statistica expects that the data file contains coding variables with integer values or text values that uniquely identify to which cell in the table each case belongs.
- FREQUENCIES WITH CODING VARIABLES
If the file contains frequencies, Statistica can read those directly. If Frequencies with coding variables is selected, Statistica expects coding variables with integer codes or text labels that uniquely specify the cell in the table to which each frequency belongs, and a variable containing the frequency. The example data file
Center2.sta provided with Statistica is organized in this manner.
- FREQUENCIES W/OUT CODING VARIABLES
If frequencies w/out coding variables is specified, Statistica will read the data variable by variable and case by case, and interpret consecutive data points as frequencies of the table as specified by the Specify table option. Thus, you can type tables directly into your spreadsheet (without having to add any codes) and process them with Log-Linear.
|
| Variables
|
Click the
Variables button to display a
standard variable selection dialog box. If
Raw Data or
Frequencies w/out coding variables is selected in the Input file box, select the variables denoting the factors; those variables should contain the codes or text labels that identify the cells of the table. If Frequencies with coding variables is selected in the Input file box, select the variable containing the frequencies and the variables (factors) with the codes that specify the table.
|
| Select codes
|
Click the
Select codes button to display the
Select codes for factors dialog box. You can use the asterisk (*) option in each box to automatically select all codes or text labels in the respective variable or factor, or you can click the
Select All button. The
Select codes button is only available if either Raw Data or
Frequencies with coding variables is selected in the
Input file box, and after Variables ( factors or "independent" variables) have been selected.
|
| Specify table
|
Click the
Specify table button to display the
Specify the dimensions of the table dialog box. Statistica interprets all consecutive data points that are read (variable by variable, case by case) as frequencies of the spreadsheet. In order to instruct the program as to which cell of the spreadsheet each frequency belongs, you must specify the design (or "shape") of the spreadsheet. Note that the Specify table button is only available if Frequencies w/out coding variables is selected in the Input file box.
|
| OK
|
Click the
OK button to display either a
standard variable selection dialog box or the
Log Linear Model Specification dialog box (if you have already selected variables via the
Quick tab).
|
| Cancel
|
Click the
Cancel button to close the
Startup Panel without performing an analysis.
|
| Options
|
See
Options Menu for descriptions of the commands on this menu.
|
| Open Data
|
Click the
Open Data button to display the
Select Data Source dialog box, which is used to choose the spreadsheet on which to perform the analysis. The
Select Data Source dialog box contains a list of the spreadsheets that are currently active.
|
| Select Cases
|
Click the
Select Cases button to display the
Analysis/Graph Case Selection Conditions dialog box, which is used to create conditions for which cases will be included (or excluded) in the analysis. More information is available in the case selection conditions overview, syntax summary, and dialog box description.
|
| W
|
Click the
W (Weight) button to display the
Analysis/Graph Case Weights dialog box, which is used to adjust the contribution of individual cases to the outcome of the current analysis by "weighting" those cases in proportion to the values of a selected variable.
|