How do I fit a custom-defined function to data?
The custom-function plotting facility, accessible on the Custom Function tab of the Graph Options dialog box, plots the requested (custom-defined) functions and overlays them on the existing graph. It does not fit these functions to the data. A selection of the most commonly used, predefined functions that can be fitted to the data and smoothing procedures is available in the Plot: Fitting tab of the Graph Options dialog box (e.g., linear, logarithmic, exponential, various polynomial, distance-weighted least squares, spline, and others). See How do I fit a function to data?.
Comprehensive facilities to fit to data (and interactively plot in two or three dimensions) user-defined functions of practically unlimited complexity are provided in the Nonlinear Estimation module.
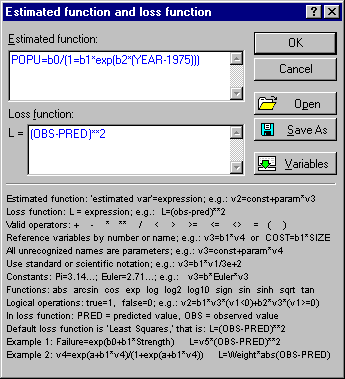
See the Estimated function and loss function topic for more details.