Example 1: Specifying Tables Directly (Frequency Table Input)
In this example, we will specify a 4x2x3x3 frequency table that is read directly, without any coding variables.
Procedure
Open the
Center.sta data file and start Log-Linear Analysis, located in the Datasets folder.
Select the
Statistics tab. In the
Advanced/Multivariate group, click
Advanced Models and from the menu, select Log-Linear to display the
Log-Linear Analysis Startup
Panel.
From the
Input file drop-down list, select
Frequencies w/out coding variables.
Click the Variables button to display the
standard variable selection
dialog box. Select all variables in the file, and click the
OK button.
In the
Startup Panel, click the
Specify table
button to display the
Specify the dimensions of the table
dialog box. We need to specify exactly how the frequencies are represented in the table.
In the spreadsheet, the levels of four factors (Appearance,
Survival,
Age, and
Location) are used as the case names and variable names (or column headings). The first factor that we will list in the Specify the dimensions of the table dialog box needs to be the one with the "fastest changing subscript," the second factor as the one with the second-fastest changing subscript, and so on. Since Statistica reads the frequencies across rows, the factor with the fastest changing subscript in this example, is the factor whose levels are listed in the column headings of the spreadsheet - Appearance.
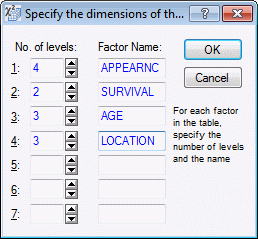
In the
Specify the dimensions of the table dialog box, type in 4 for the number of levels for this factor and
Appearnc as the factor name. The next fastest changing factor is Survival since the 2 levels of this factor (Yes or No) change from line to line (listed in the Case Names column).
Type in this factor name and the number of levels in the second line of this dialog box. Specify the remaining two factors in lines 3 and 4, respectively, as follows: 3 levels (under 50, 50-69, and over 69) for factor Age, and 3 levels (Tokyo, Boston, and Glmrgn) for factor Location.
Click
OK to return to the
Startup Panel, where the table to be analyzed will be displayed in the
Summary box (the area at the top of the dialog box).