In Database Analytics: Overview
With the size of data constantly growing, it becomes more challenging to bring the data across the network for analysis. It can even be impossible if the size of the data exceeds the hardware limits of the application server that is used for the analysis. This demands for the analysis to be brought to the data in a way that utilizes technical resources of the database system and possibly distributes computations, when the latter consists of multiple nodes. Consider a simple example on how this can be accomplished. Assume that the PredictorsOfYield table is uploaded to the Microsoft SQL Server database, and we need to compute the correlation between two columns: Yield and Param_3_avgval1. Traditionally, we would extract the data using, e.g., the following query:
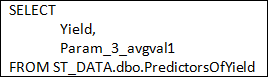
and then use a statistical module to calculate Pearson’s correlation coefficient.

On this route, the whole data set with Yield and Param_3_avgval1 is imported into Statistica. Another way to accomplish this task is to offload the computation of aggregation functions to the database itself. For this we need to rewrite the correlation coefficient as follows:

So instead of bringing raw data, we can simply bring aggregates
and it would be sufficient to compute correlation. Database systems are generally very efficient in computing aggregate functions. Moreover, after parsing the SQL query, the database engine optimizes it and comes up with the execution plan, which can also distribute the actual computations between multiple nodes of the database if available. Obviously, the aggregated data is small in size and can be easily processed on the client side. Here, we can run the following select statement:
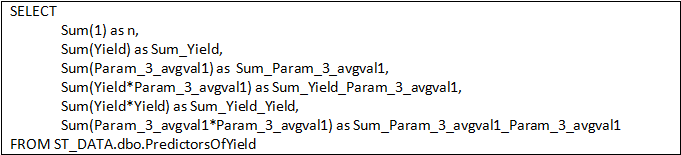
and then perform final computations outside of the database or, in the case of correlation coefficient, we can receive the final result back.

The SQL syntax will look very similar for various database engines that have an OLE DB or ODBC interface. Beyond the example of simple correlation between two variables, the queries become much more complex and require an automated process to generate them. It is also the case that in the majority of modules the final result is not delivered by the query itself, but is rather calculated based on the aggregated data. Some modules require execution of a series of queries before the final result is achieved. Statistica In-database Analytics nodes automate such processes and provide a simple user interface consistent with traditional data mining and statistical modules and nodes.
Workflow
In order to use In-Database Analytics nodes, you need Statistica Enterprise Server. The prerequisite for the analysis is to create a database connection and a data configuration. See the requirements section below for more information about permissions.
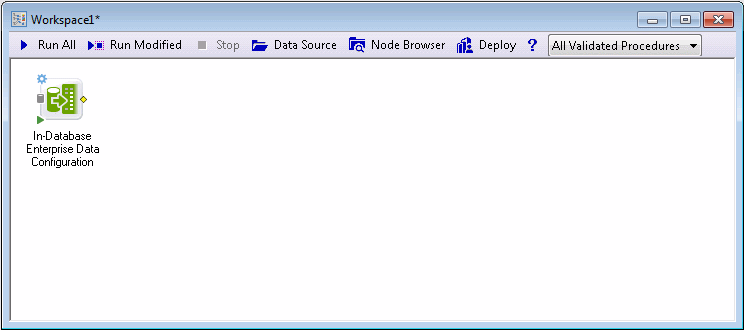
Step 1. Add the In-database Enterprise Data Configuration node to a workspace.
On the specifications tab, specify the path or browse to the data configuration object to be used for in-database analytics.

Unlike many other nodes in Statistica that operate on spreadsheets, in-database analytics nodes do not require spreadsheets to operate on, however they do need a database connection object, which is created by the In-Database Enterprise Data Configuration node. This object consists of the connection itself and a query. Use the Create an output spreadsheet check box to extract the first N rows as specified by the Max Rows parameter, and make it visible as a downstream document (Max Rows set to 0 will extract all of the data). This functionality is added for the initial design and troubleshooting and is not intended to be enabled during production runs. Note that enabling this option can significantly decrease the performance of the system. The Database Type drop-down list helps to resolve situations where automated database detection is not possible.
Step 2 (optional). Add a data preparation or sampling node.

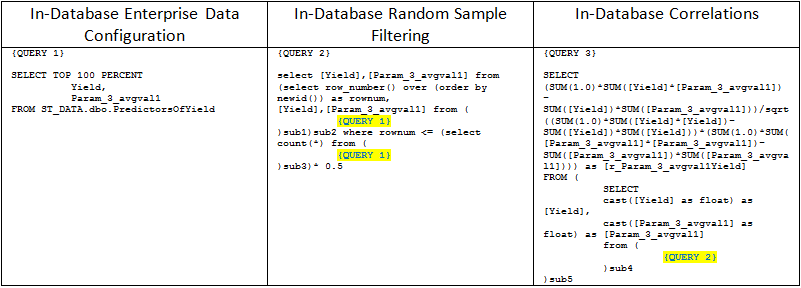
Nodes of this type are not supposed to perform any tasks on the database side, but, rather, operate on the database connection object and, specifically, on the query. In-database Random Sample Filtering will take the upstream SQL query and add a sampling part to it. The example is described in Table 1.
This example executes Simple random sampling, extracting 50% of the cases.

Step 3. Add an analysis node.

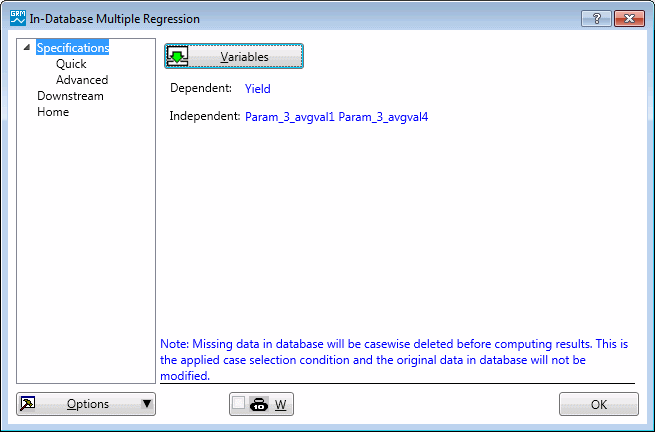
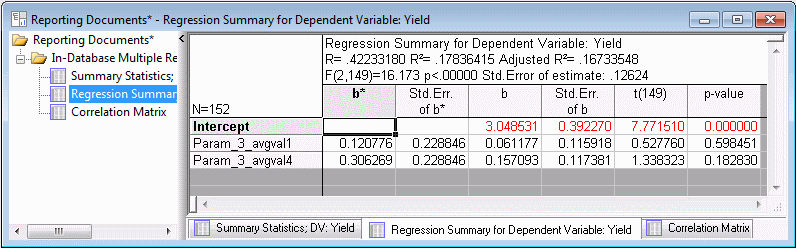
This example uses the In-Database Multiple Regression node. In general, in-database analyses nodes are used to select decision variables and define parameters of the analysis. By design, these nodes are the ones that execute tasks on the database side and bring the results back. These results can be produced as a downstream document or a collection of objects in the Reporting Documents workbook.
For the multiple regression, selected is Yield as dependent variable and Param_3_avgval1, Param_3_avgval4 as independent.
Step 4. Execute the workspace
Once the workspace is executed, it establishes connection to the database, prepares and executes the in-database tasks, and finally shows the results.
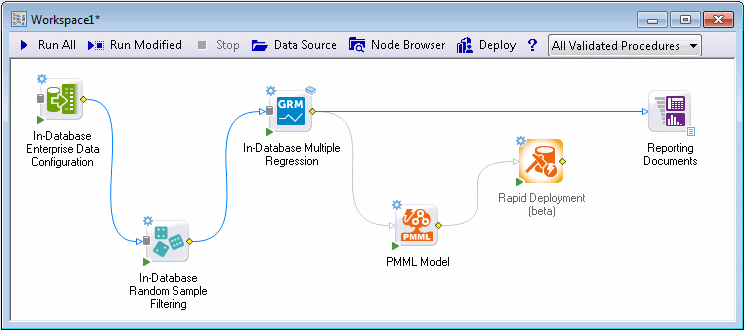
In this case, the PMML Model and various Regression statistics were produced.
Mapping of the Statistica Workspace Concept to the In-Database Job
To illustrate the mapping between the workspace nodes and the actual SQL queries sent to the database, we will return to the correlations example. As shown in Table 1, the In-Database Enterprise Data Configuration node is creating connection to the database and utilizes the query from the data configuration. Next, In-Database Random Sample Filtering adds auxiliary parameters to the upstream query and sends it downstream without executing anything. Finally, the In-Database Correlations adds statistical calculations and sends the job to the database for execution.
Table 1. Illustration of the Correlation Calculation In-database Split between Several Nodes
Notes on accuracy
Bringing analytics to the database helps to improve on performance and makes the solution scalable. However, it also moves calculations to a different engine. As such, the approach is leveraging the database built-in functions and relies on the number representation within the database. Databases differ in data types and functions. Even though in-database analytics nodes perform necessary conversions of types and utilize common for the majority of SQL patterns, it is hardly possible to maintain the same level of accuracy across all databases. In order to obtain the highest level of accuracy and consistency it is recommended to import the data into Statistica and run the analysis with common Statistica modules (which also work with Streaming DB Connector).
Performance considerations
Performance of the in-database analytics analyses relies on the database engine and the amount of data stored. However, it should be noted, that some tasks can take a considerable amount of time and impact performance of the database.
Requirements
Requirements are primarily related to the Statistica Enterprise permissions to access data with a data configuration (mostly read access). Some methods, e.g. In-Database Logistic Regression, may require permissions to CREATE, UPDATE, SELECT and DROP temporary tables. For Microsoft SQL Server, this extends to the ability to create tables on tempdb, but varies between other database engines. In terms of database versions, the latest one is always recommended.
For Microsoft SQL Server: SQL Server 2012 or later.
Limitations
Database systems impose limitations that in-database analytics nodes have to satisfy. Some major limitations by database type are described below.
SQL Server limitations - Source: Maximum Capacity Specifications for SQL Server, https://msdn.microsoft.com/en-us/library/ms143432.aspx, extracted 8/14/2015.
The limitations can lead to the following as an example:
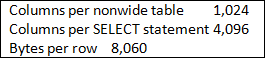
1) To build a multiple regression model, the query should fit in 4096 columns. In terms of a correlation matrix, this translates into a maximum of 91 columns that can be in the design matrix in order to be able to calculate all sums for different combinations in a single query. The select statement for a correlation matrix with 91 variable contains 91*(91-1)/2 = 4095 columns.
2) Any temporary tables created on the database side for intermediate calculations should not exceed 1024 columns and 8060 bytes (for reference, a row of columns of type float takes 8 bytes * 1024 = 8192 bytes > 8060 bytes).