How do I replace numeric scale values with text labels?
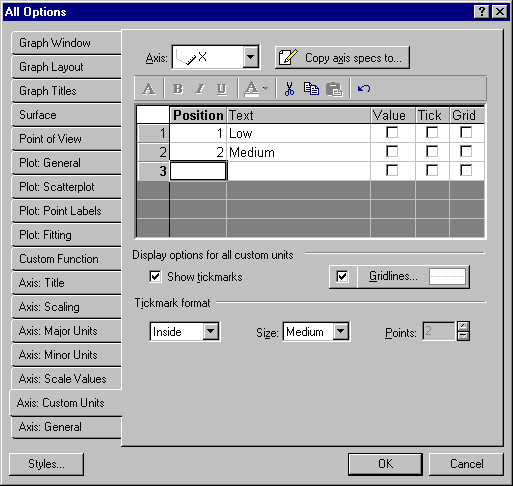
On the Axis: Scale Values tab of the Graph Options dialog box, select the Use text labels from data set check box. Note that if the variable plotted on this particular axis does not have text labels, you can create custom labels instead on the Axis: Custom Units tab of this dialog box; you can create custom labels using an editable custom labels spreadsheet in which you can enter the appropriate numeric values (determining where the text labels are to be placed on the axis) and the corresponding text value labels.

For example, if the values were entered as in the dialog box shown above, the label Low would be placed in the location of 1 on the axis, label Medium in the location of 2, etc.
Copyright © 2021. Cloud Software Group, Inc. All Rights Reserved.
