Example 1: 2 x 2 Tables
In this exercise, you will specify the frequencies for a 2 x 2 contingency table and review the results of the summary spreadsheet. No specific data set is required; however, you must have an input spreadsheet open.
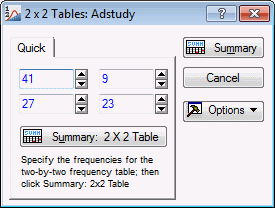
Specifying the Analysis. Suppose that you are considering whether to introduce a new formula for a successful soft drink. Before finally deciding on the formula, you conduct a survey in which you ask male and female respondents to express their preference for either the old or new soft drink. Assume that out of 50 males, 41 prefer the new formula over the old formula; out of 50 females, only 27 prefer the new formula.
Ribbon bar. Select the Statistics tab. In the Base group, click Nonparametrics to display the Nonparametric Statistics Startup Panel.
Classic menus. From the Statistics menu, select Nonparametrics to display the Nonparametric Statistics Startup Panel.
Select 2 x 2 Tables (X2/V2/Phi2, McNemar, Fisher Exact) from the Quick tab, and click the OK button to display the 2 x 2 Tables dialog box. On the Quick tab, enter frequencies into the four cells of a 2 x 2 contingency table. Enter the data as follows:
- Reviewing the summary spreadsheet
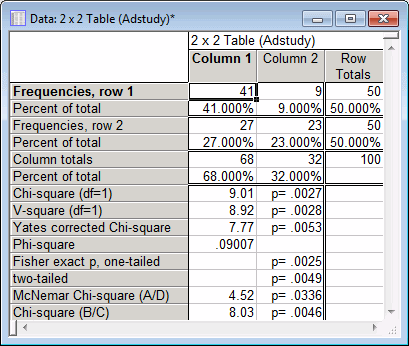
- Now, click the Summary: 2X2 Table button to display a spreadsheet of results. Note that you could also click the Summary button.
Chi-square, V-square. The Chi-square value for these numbers (9.01) is highly significant (refer to Elementary Concepts for an explanation of the basic idea of statistical significance testing). Thus, the preferences expressed by males are significantly different from those of females (apparently, the new formula is mostly preferred by males). The V-square statistic is a Chi-square corrected for sample size (Kendall and Stuart, 1979; see also Rhoades and Overall, 1982). If the frequencies in the table are rather small (e.g., less than 10 on the average), you should probably rely on the V-square statistic rather than Chi-square.
The rationale behind the V-square statistic (and other corrections for small n) is as follows: Imagine that you observe 3 and 7 in one row of the 2 x 2 table. Then the probability of an observation falling into the first cell can be estimated as 30%, and, likewise, the probability of an observation falling into the second cell as 70%. However, you could equally well estimate those probabilities as 34% and 66%, respectively; the observed data would still be perfectly consistent. In other words, with low n, there is a great uncertainty regarding the estimation of underlying probabilities (and expected values), and the V-square adjusts for this uncertainty. The V-square statistic will, therefore, always be smaller than the Chi-square.
Phi-square. Another way of looking at the example above is to say that Gender is correlated with Preference. This correlation is expressed via Phi-square.
- Fisher exact test
- Given the marginal frequencies (i.e., 50, 50, 68, and 32 in this example), and assuming that in the population, males and females, do not differ in their preferences, how likely is it to obtain cell frequencies as uneven or worse than the ones you found in this study? For small N, this probability can be computed exactly by counting all possible tables that can be constructed based on the marginal frequencies. This is the underlying rationale for the Fisher exact test. It computes the exact probability under the null hypothesis of obtaining the current distribution of frequencies across cells, or one that is more uneven. Both one-sided and two-sided probabilities are reported.
McNemar Chi-square. This test is applicable in situations where the frequencies in the 2 x 2 table represent dependent samples. For example, in a before-after design study, you may count the number of students who fail a test of minimal math skills at the beginning of the semester and at the end of the semester. Two Chi-square values are reported: A/D and B/C. The Chi-square A/D tests the hypothesis that the frequencies in cells A and D (upper-left, lower-right) are identical. The Chi-square B/C tests the hypothesis that the frequencies in cells B and C (upper-right, lower-left) are identical.
Note: STATISTICA also includes two designated modules (Basic Statistics and Tables and Log-Linear) for the analysis of frequencies and contingencies in multidimensional tables of practically unlimited size and complexity. The Tables and Banners option of the Basic Statistics and Tables module produces a comprehensive set of descriptive and inferential statistics (including Kendall tau-b, tau-c, Gamma, concordance coefficients, entropy measures, and other coefficients of dependence); the Log-Linear module performs complete log-linear analyses of multi-way frequency tables.See also, Nonparametric Statistics - Index.


