Example 9: Attribute Gage Study (Analytic Method)
This example illustrates the use of Statistica Attribute Gage Study (Analytic Method) (part of the Process Analysis - Industrial Statistics module) for attribute gage bias and repeatability study in process analysis.
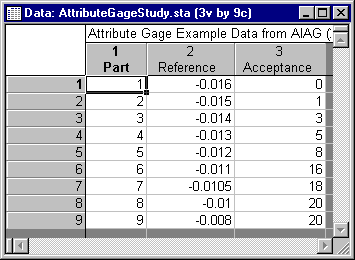
- Data file
- Consider a fictitious study where an attribute gage is used to measure a dimension that has tolerance of +/- 0.010. The gage is an end-of-line 100% automatic inspection gage and is affected by repeatability and bias. The data used for the analysis are taken from the example data published in the AIAG (2002) Measurement System Analysis (MSA) Reference Manual, volume III. This data are contained in the Statistica data file AttributeGageStudy.sta located in the Statistica/Examples/Datasets directory. This data set contains three variables, the first (Part) which identifies the parts for which measurements were made. The second column (Reference) contains the reference values belonging to each part, and the third column records the number of times the part was accepted in 20 trials.
- Specifying the analysis
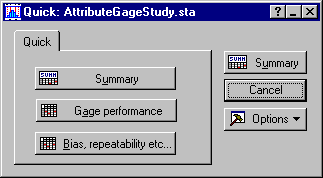
- From the Statistics - Industrial Statistics & Six Sigma submenu, select Process Analysis to display the Process Analysis Procedures Startup Panel. On the Quick tab, select Attribute gage study (Analytic method) and click OK to display the Attribute gage study (Analytic method) dialog. This dialog has one tab, Attribute gage study.
First, we will select the variables for our analysis. On the Attribute gage study tab, click the Variables button to display a standard four variable selection dialog. In the first column, select Part #. In the second column, select Reference, and in the third column select Acceptance. The fourth column can be used to select an option variable that records the Number of trials. Since our data used a constant trial size (20), we will specify that information in the Attribute gage study (Analytic method) dialog.
After selecting the variables as shown above, click OK to return to the Attribute gage study (Analytic method) dialog.
- Testing for bias
- In Statistica, two methods are available for testing bias = 0. To use the AIAG method, you must have eight parts for which exactly 20 trials have been conducted. One part must have 0 acceptances and one part must have 20 acceptances. The parts in between these two extreme parts can have any number of acceptances between 1 and 19. When testing with the regression method, you are still required to have the two extreme parts; however, you can have more than six parts between them and you are only required to conduct a minimum of 15 trials. For this example, we will use the default AIAG method.
- Binary attributes
- When the data contain aggregated counts (such as ours), it is necessary to specify how many trials were conducted and to designate and Attribute label. As mentioned above, you can include a variable in your data set the records the number of trials per part; but when a constant trial size is used, you can also enter that information here. For our example, leave the Number of trials set to 20 and use the default Attribute label, Acceptance.
- Tolerance limit for calculation
- Because the exact measurement for the part is not known (i.e., we only know if the part was accepted or rejected based on established standards), the calculation for bias is based on a specified tolerance limit. For more details on this calculation, see
Computational Details. In general, you only need to specify one tolerance limit. If the probability of acceptance follows an increasing trend as the references increases, i.e., parts with a lower reference number have a lower probability of acceptance and parts with a higher reference number have a higher probability of acceptance, then you need to specify a lower tolerance limit. When the number of acceptances decreases as the reference value increases, then you need to specify an upper tolerance limit. For our example, the number of acceptances increases as the reference value increases, so we will specify the lower limit. As indicated above, this lower limit is -0.010. The Attribute gage study (Analytic method) dialog should now look as shown below.
Next, click the OK button to display the Results: AttributeGageStudy dialog.
- Reviewing the results
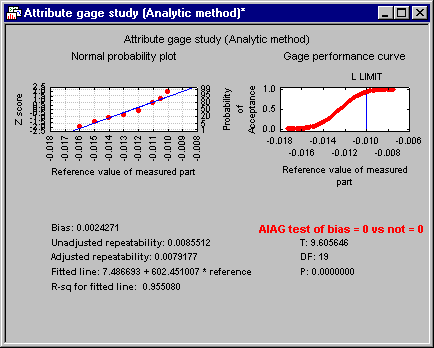
- Summary results for a gage attribute study typically include a normal probability plot of the reference values, a Gage Performance Curve, results for the
t-test of bias = 0, and certain gage statistics. Click the Summary button to display a multiple plot that contains all of this information.
There are slight discrepancies between the results here and the results in the AIAG manual due to rounding of specific constants and reference values (see the Computational Details), the final results are very similar. As you can see, the adjusted repeatability is 0.0079 and the bias is 0.0024. The t-statistic for testing bias = 0 is 9.6. We are able to reject the hypothesis that there is no bias in the gage.