Introductory example - correlations
Customization of Statistica
Practically all aspects of the behavior and appearance of Statistica (even many elementary features illustrated in this example, such as where all output is directed), can be permanently customized to match your preferences. For example, even the first step (opening Statistica) can be customized; you can change the default full-screen opening mode, the appearance of the data spreadsheet, toolbars.
Selecting a data file
- Ribbon bar: Select the Home tab. In the File group, click the Open arrow and from the menu, select Open Examples to display the Open a Statistica Data File dialog box. Open the data file, which is located in the Datasets folder.
- Classic menus: From the File menu, select Open Examples to display the Open a Statistica Data File dialog box. Open the data file, which is located in the Datasets folder.
Data spreadsheets (multimedia tables)
Statistica data files are always displayed in a spreadsheet (that is, a spreadsheet is a data file or data set). Statistica Spreadsheets use a powerful multimedia table technology, and they can contain not only practically unlimited amounts of data but also sound, video, embedded documents, automation scripts, and custom user interfaces.
It is possible to have more than one data spreadsheet open at a time (with each spreadsheet connected to a different analysis). Note that data management facilities are available from the Data tab or menu whenever a spreadsheet is open.
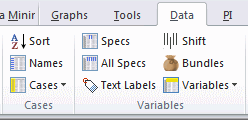
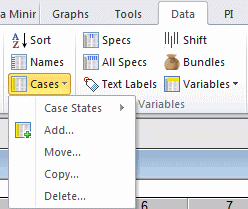
Ribbon bar. On the Data tab, the Cases group and the Variables group contain options to restructure the data file.
Click Cases or Variables to display a menu with more options.
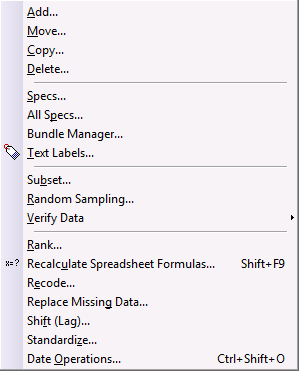
Classic menus. The
Spreadsheet toolbar contains the
![]() (Variables) and
(Variables) and
![]() buttons, which display menus that contain options to restructure the data file.
buttons, which display menus that contain options to restructure the data file.
All the above options are described in the Spreadsheet toolbar topic.
Spreadsheet formulas
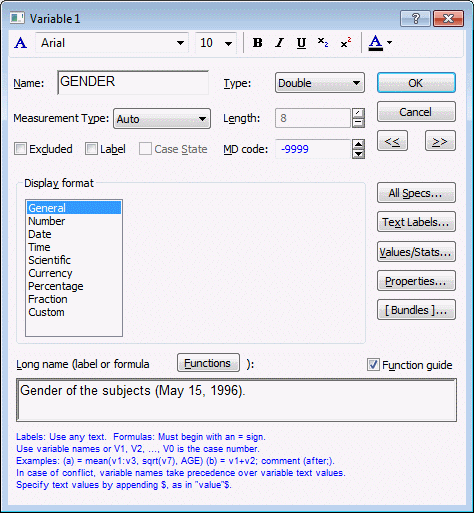
In the variable specification dialog box, you can change the variable name and format, enter a formula to recalculate the values of the variable. If the entry in the Long name box starts with an equal sign (=), Statistica interprets it as a formula [a comment can follow after a semicolon (;)]. For example, if you enter into the Long name box (of variable one) =(v2+v3+v4)/3 or =mean(v2:v4), the current values of that variable are replaced by the average of variables two through four, separately for each case (row) of the spreadsheet.
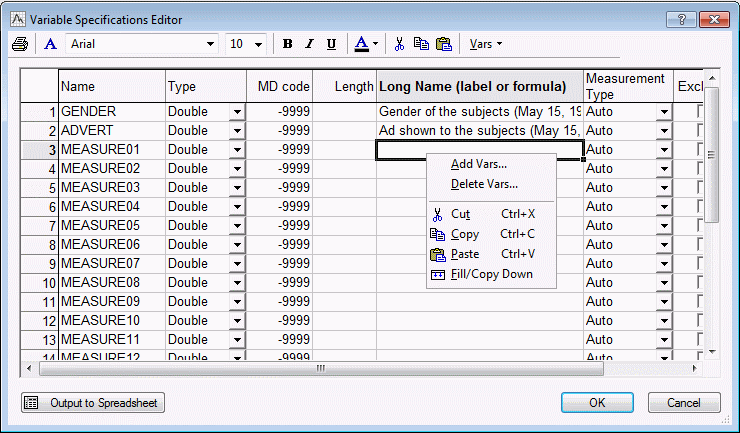
Specifications of all variables can also be reviewed and edited together in a combined Variable Specifications Editor, accessed by clicking the All Specs button in the Variable specifications dialog box. You can right-click in a cell to display a shortcut menu containing useful options.
Shortcut menus in the spreadsheet
Five ways of handling output
You can customize the way the output is managed in Statistica. When you perform an analysis, Statistica generates output in multimedia tables (spreadsheets) and graphs. There are five basic channels to which you can direct all output:
The first four output channels listed above are controlled by the options on the Output Manager tab of the Options dialog box, and can be used in many combinations (example, sending data to a workbook and report simultaneously), and each output channel can be customized in a variety of ways. Also, all output objects (spreadsheets and graphs) can contain other embedded and linked objects and documents, so Statistica output can be hierarchically organized in a variety of ways. There are a number of ways to output to the web, depending on the version of Statistica you have.
Calculating a correlation matrix
Continuing the example by computing a correlation matrix for the variables in the Adstudy.sta data file.
First, ensure that a block (a group of selected cells) is not selected in the spreadsheet (to deselect a block, click the cursor in any cell in the spreadsheet). If a block is selected, Statistica assumes that the variables in the block are intentionally preselected for the analysis, and when you later click the OK or Summary button, Statistica automatically produces the correlations only for the selected block of variables.
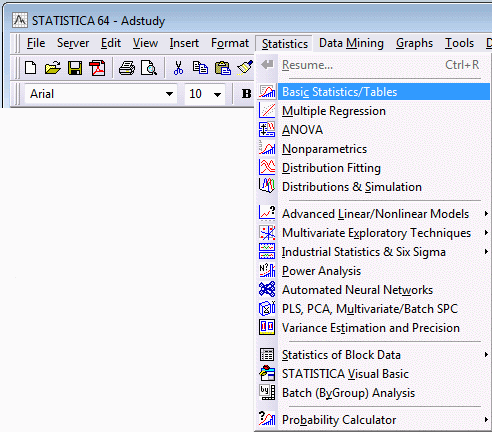
- You can start the Basic Statistics module in the following ways.
- Click the Start
 button in the lower-left corner of the application, and on the
Statistics submenu, select
Basic Statistics/Tables.
- The Basic Statistics and Tables dialog box is displayed and select Correlation matrices.
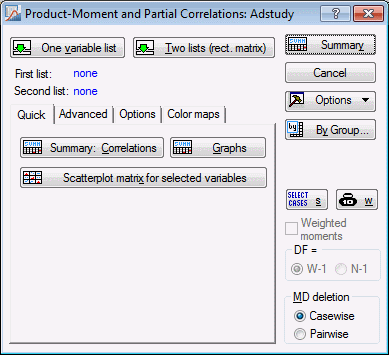
- Click the OK button to display the Product-Moment and Partial Correlations dialog box. Alternatively, you can double-click Correlation matrices to display the Product-Moment and Partial Correlations dialog box.
Quick vs. advanced analyses
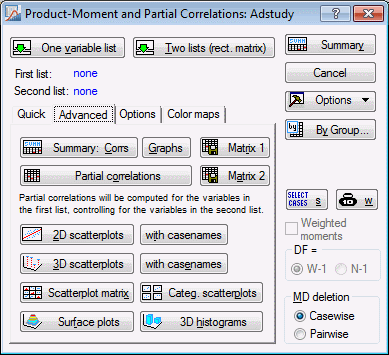
As with most analysis dialog boxes (and several other types of Statistica dialog boxes), the Product-Moment and Partial Correlations dialog box is organized by the type of options available. Typically, at least two types of analyses are available.
The Quick tab of a dialog box contains the most commonly used options, making it possible for you to specify a basic analysis quickly without having to search through a variety of options.
The Advanced tab contains the options available on the Quick tab as well as a variety of less commonly used options (example, in this case, options to save matrices, produce less commonly requested statistics, or produce a variety of plots).
Additional tabs are often available as well, depending on the type of analysis. Note that in some cases, only a Quick tab is available.
In most dialog boxes in Statistica, pressing
F1 on your keyboard or clicking the
![]() button in the upper-right corner displays a Help topic with information about the options available on the currently selected tab.
button in the upper-right corner displays a Help topic with information about the options available on the currently selected tab.
The "self-prompting" nature of all dialog boxes
All dialog boxes in Statistica follow the "self-prompting" convention, which means that whenever you are not sure what to select next, click the OK button or the Summary button and Statistica proceeds to the next logical step, prompting you for the specific input needed (example, variables to be analyzed).
Variables button
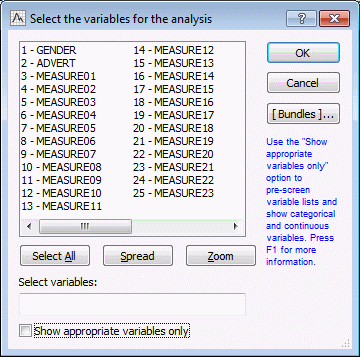
The Product-Moment and Partial Correlations dialog box is a typical analysis definition dialog box with options to select the variables to be analyzed and options to review summary statistics and graphs. Every analysis definition dialog box in Statistica contains at least one Variables button, which is used to display the variable selection dialog box, in which you specify the variables to be analyzed.
Variable selection dialog box
In the Product-Moment and Partial Correlations dialog box, click the One variable list button to display a variable selection dialog box.
The variable selection dialog box supports various ways of selecting variables (including the standard Windows Shift+click and Ctrl+click conventions to select ranges and discontinuous lists of variables, respectively).
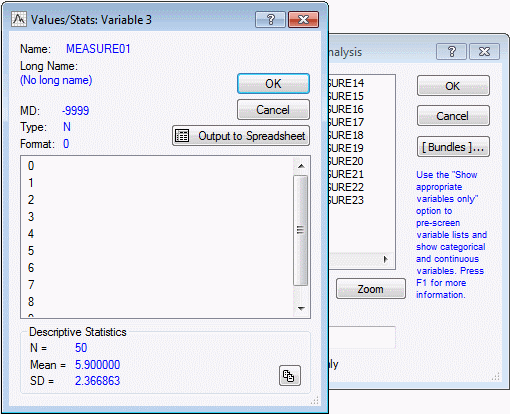
The variable selection dialog box also offers various shortcuts and options to review the contents of the data file. For example, you can spread the variable list to review the variables long names or formulas (by clicking the Spread button); or you can zoom in on a variable (by clicking the Zoom button) to review a sorted list of all values and descriptive statistics for the variable, as shown.
- Select the Show appropriate variables only check box at the bottom of the variable selection dialog box.
- Click the Select All button, which selects all the displayed variables.
- Click the OK button to return to the Product-Moment and Partial Correlations dialog box.
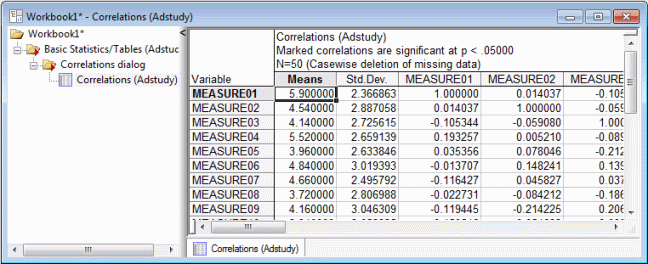
- Click the Summary button to generate a correlation matrix for the selected variables.
Results spreadsheets (multimedia tables)
In addition to storing data, spreadsheets are used in Statistica to display most of the numeric output. Spreadsheets offer many display features, such as significant correlations are marked with a different format to help distinguish them; by default the color is red. Spreadsheets can hold anywhere from a short line to gigabytes of output, and they offer a variety of options to facilitate reviewing the results and visualizing them in predefined and custom-defined graphs, as explained further in this example.
Spreadsheet options
As mentioned earlier, most spreadsheet facilities are accessible by the buttons on the Data tab (ribbon bar) or the Spreadsheet toolbar or Data menu (classic menus) and the shortcut menus (displayed by right-clicking in any cell). You can try these options to see the way they work, or you can review their descriptions by pressing the Help key (F1) while hovering over the option with the mouse pointer. For example, you can change all aspects of the display formats for each column, edit the output, or append blank cases and variables to make room for notes or output pasted from other sources. Spreadsheets can be printed in a variety of ways (by default, in presentation-quality tables with gridlines). Also, since spreadsheets are used for input, you can easily specify an analysis using the results from a previous analysis (for example, you could use this correlation matrix to specify a multidimensional scaling analysis). To use a results spreadsheet as an input spreadsheet, select the spreadsheet. Then: Ribbon bar - on the right side of the Data tab, click the down arrow and select the Input check box. Classic menus - from the Data menu, select Input Spreadsheet.
Analysis workbooks and other output options
All results (spreadsheets and graphs) can be displayed (and stored) in stand-alone windows, reports, or workbooks, which represent the default (and perhaps the most versatile) way of handling output from analyses. Depending on your selections in the
Output Manager, results can be sent to a single workbook that holds the results from all analyses, multiple workbooks that hold the results from each analysis, the workbook that contains the original data file, or a preexisting workbook. Additionally, you can choose to have the results sent to a workbook automatically, or you can send selected stand-alone spreadsheets or graphs to a workbook: Ribbon bar - select the
Home tab; in the
Output group, click
Add to Workbook. Classic menus - click the
![]() toolbar button.
toolbar button.
Output Manger
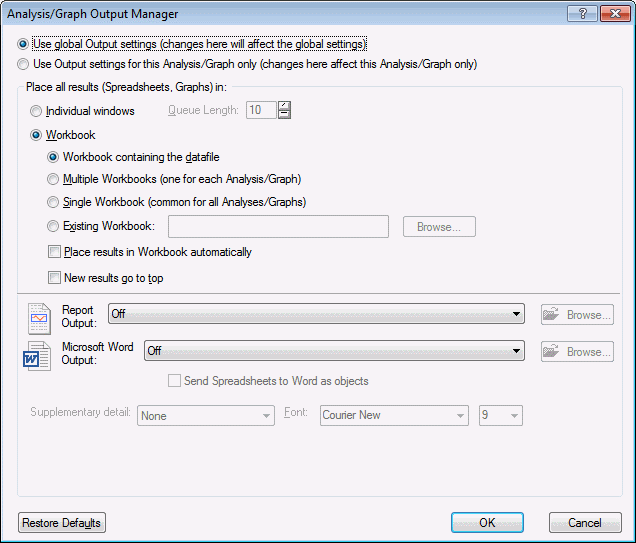
Which type of workbook you choose, or whether you choose to use a workbook, depends entirely on how you prefer to store your data and results. To change the output destination for results of a particular analysis only, click the
![]() button in any analysis or graph specification dialog box and select
Output to display the
Analysis/Graph Output Manager dialog box.
button in any analysis or graph specification dialog box and select
Output to display the
Analysis/Graph Output Manager dialog box.
To change output options for all analyses, use the (global) Output Manager (the Output Manager tab of the Options dialog box):
Ribbon bar. Select the Tools tab and click Options to display the Options dialog box. Select the Output Manager tab.
Classic menus. From the Tools menu, select Options to display the Options dialog box. Select the Output Manager tab.
Or select the Use global Output settings (changes here will affect the global settings) option button in the Analysis/Graph Output Manager dialog box.
As with all workbooks, individual documents (example, spreadsheets, graphs) or groups of documents can be printed, extracted, copied, and deleted from an analysis workbook.
Copy vs. Copy with Headers
Contents of spreadsheets can be copied to the Clipboard using either the default Copy by pressing Ctrl+C (which copies only the contents of the selected block) or selecting Copy with Headers from the Edit tab or menu (which copies the block along with its respective variable and case names). If pasted into a word processor document, spreadsheets appear as active (in-place editable) Statistica objects, standard RTF-formatted tables, or tab-delimited text (depending on your choice in the Paste Special dialog box of the word processor).
Printing spreadsheets
To produce a hard copy of an output spreadsheet, select
Print from the
File tab or menu (or press
Ctrl+P) to display the
Print dialog box, in which you specify printing options. You can also use the shortcut method by clicking the printer toolbar button
![]() . This shortcut method does not display the
Print dialog box, but prints the entire current document. If you want to print a document from within a workbook, ensure that the document is selected in the workbook and select the
Selection option button in the
Print dialog box. You can also extract a copy of the document from the workbook (by dragging it from the tree pane, or right-click on the document and on the shortcut menu select
Extract as stand-alone window), and then print it.
. This shortcut method does not display the
Print dialog box, but prints the entire current document. If you want to print a document from within a workbook, ensure that the document is selected in the workbook and select the
Selection option button in the
Print dialog box. You can also extract a copy of the document from the workbook (by dragging it from the tree pane, or right-click on the document and on the shortcut menu select
Extract as stand-alone window), and then print it.
Optional reports of all output
Workbooks offer perhaps the most flexible options to manage your output. In some circumstances, however, it might be useful to automatically produce a log of all results (contents of all spreadsheets and graphs) in a traditional word processor style report format where comments and annotations can be inserted in arbitrary locations, objects can be placed side by side.
In order to create such a report, select either Single Report (common for all Analyses/graphs) or Multiple Reports (one for each Analysis/graph) in the Report Output section of the Output Manager. As mentioned above, to display this dialog box:
Ribbon bar. Select the Tools tab and click Options to display the Options dialog box. Select the Output Manager tab.
Classic menus. From the Tools menu, select Options to display the Options dialog box. Select the Output Manager tab.
Or click the
![]() button in any analysis or graph specification dialog box and select
Output to display the
Analysis/Graph Output Manager dialog box (for local changes). For global changes, select the
Use global Output settings (changes here will affect the global settings) option button in the
Analysis/Graph Output Manager dialog box.
button in any analysis or graph specification dialog box and select
Output to display the
Analysis/Graph Output Manager dialog box (for local changes). For global changes, select the
Use global Output settings (changes here will affect the global settings) option button in the
Analysis/Graph Output Manager dialog box.
In the Output Manager, you can also specify the amount of supplementary information to be included with the spreadsheet results.
Interpretation of the results
Now, let's return to the example and the correlation matrix that has been produced.
Each of the cells of the correlation matrix represents a value (in the range of -1.00 to +1.00) that reflects the relation between the variables (see the respective variable and case headers). The higher the absolute value of the correlation coefficient, the closer the relation; if the value is positive, the relation is positive (high values of one variable correspond to high values of the other variable; likewise, low values of one variable correspond to low values of the other variable). If the value is negative, the opposite is true (low values of one variable correspond to high values of the other variable).
To learn more about how to interpret values of correlations, review a comprehensive, illustrated discussion of the topic in the Statistica Help, which features the complete contents of the Statistics Textbook (an award-winning general resource on statistics that has been recommended by Encyclopedia Britannica for its "Quality, Accuracy, Presentation, and Usability").
To display Statistica Help, click the Help button
![]() in the upper-right corner of the Statistica application.
in the upper-right corner of the Statistica application.
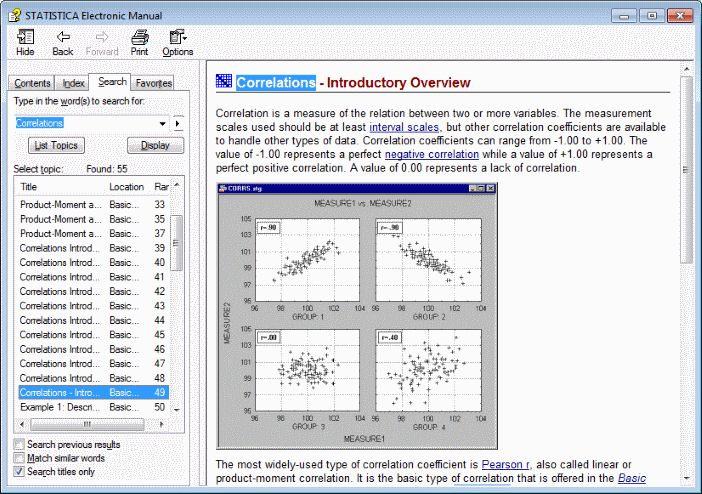
Select the Search tab. Type the subject you want to search for (example, Correlations) into the Type in the word(s) to search for box, and click the List Topics button. Select the desired topic in the Select topic list:
One of the important (and often overlooked) issues discussed in Help is the importance of scatterplots in examining correlations. For example, even very large and highly statistically significant correlation coefficients can be entirely due to one unusual data point (outlier), and if that is the case, then the correlation coefficient (even if statistically significant) would have no value to us (example, it would have no predictive validity). Following this concern, and the advice of the Statistics Textbook, you can examine a scatterplot that visualizes a relation between the variables and thus visualize a particular correlation coefficient from the table.
Producing graphs from spreadsheets
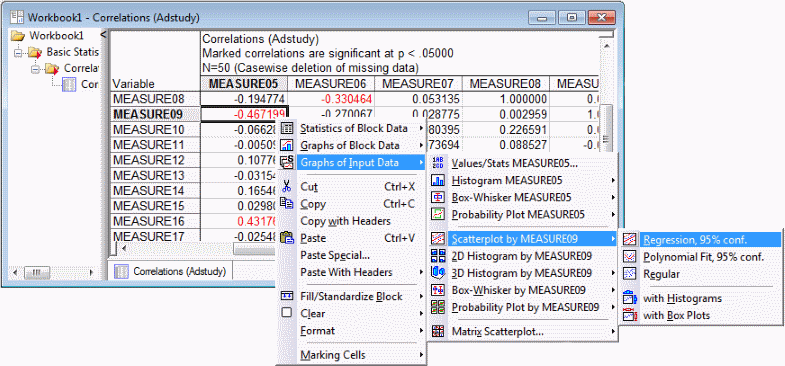
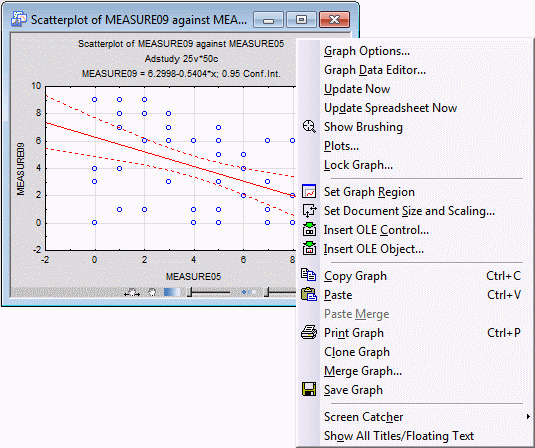
While examining the spreadsheet, you can view the correlations graphically, for example, to visualize the correlation between variables Measure09 and Measure05. To produce a scatterplot for these two variables, right-click on the respective correlation coefficient (-0.467199). In the resulting shortcut menu, select Graphs of Input Data, and then select one of the graphs in the submenu as shown.
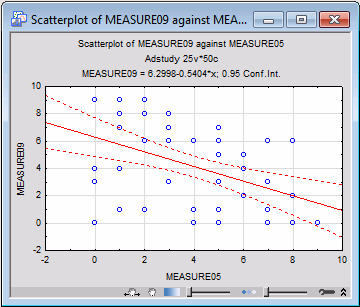
The specified graph is created.
As we can learn from the graph, there are no unusual patterns of data, thus there is no reason for being concerned about outliers.
Graph customization
Note that now, when the focus is on the graph window, the edit tab has changed (ribbon bar) and the toolbar has changed (classic menus). They contain a variety of graph customization and drawing tools. All of these options are also available from menus, and most of them are available from the shortcut menus by right-clicking on specific parts of the graph.
Return to the Adstudy.sta spreadsheet.
Split scrolling in spreadsheets
Spreadsheets can be split into four sections (panes) by dragging the split box (the small rectangle at the top of the vertical scrollbar or to the left of the horizontal scrollbar). This is useful if you have a large amount of information and you want to review results from different parts of the spreadsheet. When you move the mouse pointer to the split box, the mouse pointer changes to
![]() or
or
![]() . Now, to position the split, drag it to the desired position.
. Now, to position the split, drag it to the desired position.
You can change the position of the split by dragging the split box (now located between panes) to a new position.
Drag-and-drop
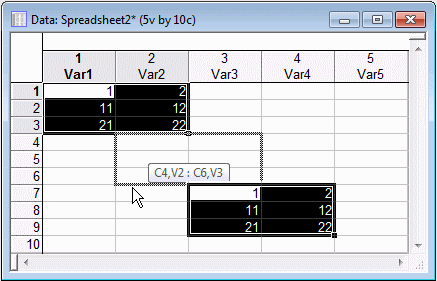
Statistica supports the complete set of standard spreadsheet (Microsoft Excel-style) drag-and-drop facilities. For example, in order to move a block, point to the border of the selection (the mouse pointer changes to an arrow) and drag it to the new location.
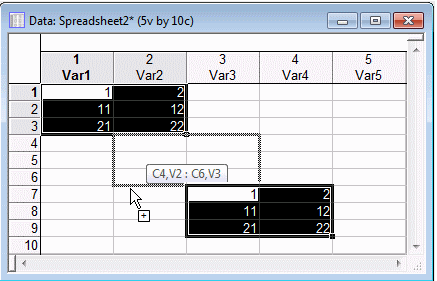
To copy a block of data, point to the border of the selection (the mouse pointer changes to an arrow) then drag the selection to a new location while pressing the Ctrl key. Note that when you are dragging the selection, a plus sign (+) is displayed next to the mouse pointer to indicate you are copying the text rather than moving it.
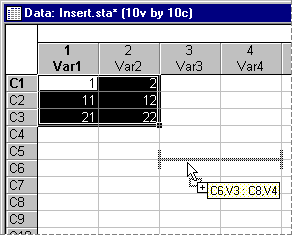
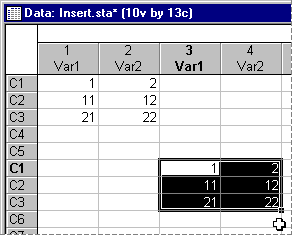
To insert a block between columns or rows, point to the border of the selection (the mouse pointer changes to an arrow) and then drag the selection while pressing the Shift key.
If you point between rows, an insertion bar is displayed between the rows, and when you release the mouse button, the block is inserted between those two rows [creating new case(s)]. If you point between columns, an insertion bar is displayed between the columns, and when you release the mouse button, the block is inserted between those two columns [creating new variable(s)].
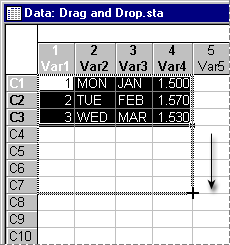
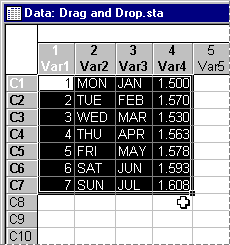
Additionally, a series of values within a block can be extrapolated (AutoFilled) by dragging the Fill Handle (a small, solid square located on the lower-right corner of the block border).
Statistica Help
For more information on any of the menu commands, press the help key (F1) when the command is highlighted. Statistica provides comprehensive Help for all program procedures and all options available in a context-sensitive manner. It is accessible by pressing the
F1 key or clicking the help button
![]() on the caption bar of dialog boxes.
on the caption bar of dialog boxes.
Due to its dynamic hypertext organization, organizational tabs (Contents, Index, Search, and Favorites), and various facilities used to customize the help system, it is faster to use the Help than to look for information in the traditional manuals.
Note also that the status bar on the bottom of the Statistica window also displays short explanations of the menu commands or toolbar buttons when an item is selected or a button is clicked.
Statistical Advisor
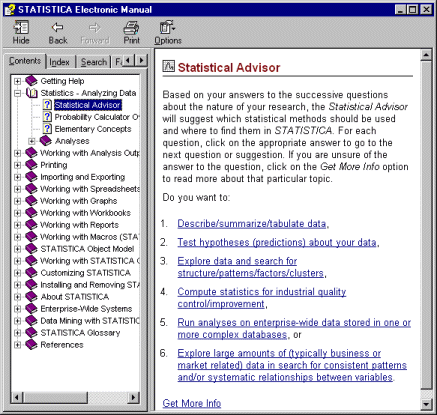
A Statistical Advisor facility is built into Statistica Help. When you select Statistical Advisor from the File - Help/Support tab (ribbon bar) or from the Help menu (classic menus), Statistica displays a set of simple questions about the nature of the research problem and the type of your data. Then the advisor suggests the statistical procedures that appear most relevant and tells you where to look for them in the Statistica system.
Direct jumps (hypertext links) are available from the Statistical Advisor topics to the corresponding Introductory Overviews that discuss in detail the respective statistical methods and procedures.


