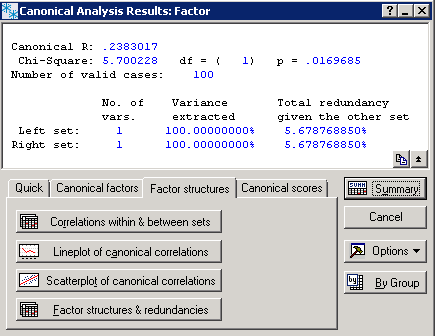
Canonical Factor Structures Tab
Select the Factor structures tab of the Canonical Analysis Results dialog box to access the options described below:
|
Button |
Description |
|---|---|
| Correlations within & between sets |
Click the Correlations within & between sets button to display spreadsheets with the correlations within each set of variables, and between sets. |
| Lineplot of canonical correlations |
Click the Lineplot of canonical correlations button to display a lineplot of the analysis using the selected variables. |
| Scatterplot of canonical correlations |
Click the Scatterplot of canonical correlations button to specify pairs of canonical variables for which to plot the scatterplot of canonical scores. |
| Factor structures & redundancies |
Click the Factor structures & redundancies button to display spreadsheets with the canonical factor loadings and redundancies (variance extracted) for both sets of variables. |
The canonical factor loadings can be interpreted as in factor analysis (see Factor Analysis), that is, they represent the correlations between the variables with the respective canonical variates.
The variance extracted is computed by summing up the squared canonical factor loadings across variables in a set for a particular canonical root, and then dividing that sum by the number of variables in the set. The resulting proportion can be interpreted as the average proportion of variance accounted for in the respective variables by the respective root. The total proportion of variance extracted that is reported at the top of the results dialog box can be interpreted as the average proportion of variance accounted for by all canonical roots.
Redundancies are computed by multiplying the proportion of variance extracted by the squared canonical correlation. The redundancies for a particular root can be interpreted as the average proportion of variance accounted for in the respective set of variables by that root, given the variables in the other set. The total redundancy reported at the top of the results dialog box is the sum of the redundancies across all roots.

