When and how can I customize Statistica graphs?
All graph customization facilities in Statistica are available when a graph window is active (thus, after a graph has been selected).
There are two major types of graph customizations:
• adding and/or editing custom graphic objects, and
• customizing the structural components of the graph.
Adding and/or editing custom graphic objects. The tools to add and edit custom graphic objects to the current graph (such as drawing, managing, and customizing objects, pasting, embedding, linking, etc.) can be accessed from the Graph Tools toolbar (classic menus) or the Edit tab (ribbon bar). Those options are also accessible from the graph Edit and Insert menus, and many of them can also be accessed from the shortcut menus.
- Customizing the structural components of the graph
- All facilities to change the structural properties of graphs (such as proportions, scales, patterns, features of individual plots, etc.) can be accessed from the Graph Options dialog box. This dialog box can be accessed from the graph Format menu as well as from shortcut menus described below.
- Using the shortcut (right-click) menus in graphs
- The easiest way to access the
Graph Options dialog box (as well as all other customization facilities) is to use the shortcut menus accessible by right-clicking on the graph. Using the shortcut menus is also often faster because they provide direct access the nested (i.e., "second-" or "third-level") tabs controlling the attributes of specific graph components.
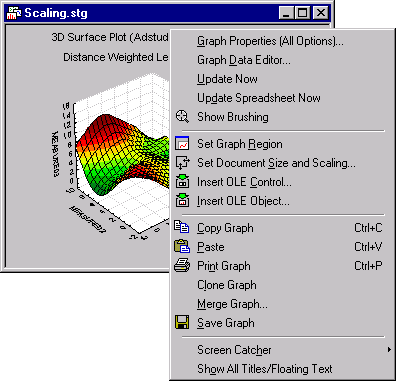
One of the graph shortcut menus has a different status than others. Specifically, unlike all other shortcut menus that are associated with specific objects, the "main" (or "background") shortcut menu (shown below), accessible by right-clicking outside the graph axes, contains global graph customization and multi-graphics management options.
- Using the left mouse button (direct access to customization dialog boxes)
- Another mouse-based shortcut to access customization facilities for specific elements of the graph is to double-click on the specific graph object or component.
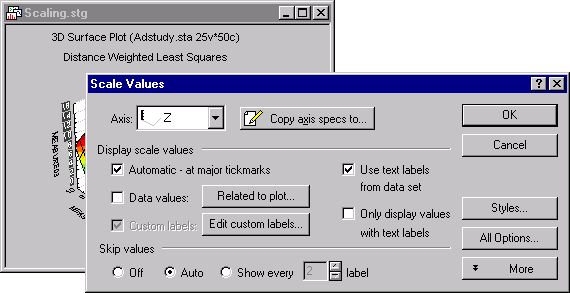
If the element you have selected this way is one of the structural components of the graph (such as a scale, point marker, or a title), then the dialog that is most commonly used to customize that type of object will automatically be displayed. For example, in the illustration shown above, double-clicking on the y-axis scale values displays the Scale Values dialog box.
- Options accessible by double-clicking on an object vs. options accessible from the shortcut menus (clicking the right mouse button).
- As mentioned before, by right-clicking on an object, a list of customization dialogs and options applying to that object will be displayed in a shortcut menu (organized hierarchically with the most commonly used option at top and progressing to the dialog with the largest set of options).
On the other hand, double-clicking displays directly the most commonly used dialog, or the global dialog that applies to the object. Therefore, double-clicking saves you one step whenever you are accessing the most commonly used option.
- Accessing the Graph Options dialog box
- The same principle also applies to displaying the
Graph Options dialog box. To access this dialog, simply double-click on the empty graph space outside the graph axes. Alternatively, you can select it from the "main" shortcut menu accessible by right-clicking on the empty graph space outside the graph axes.
Support for F4. To simplify the process of editing graph display features (e.g., font color, point markers, area patterns), Statistica provides support for the F4 key on your keyboard. This means that you can repeat the last command you performed in the graph. For example, if you have just changed the title font to Arial, 12pt, Italic, and you want to make the same change to the axis titles, simply highlight the axis title you want to update, and press F4. Note that the F4 buffer is graph specific. If you switch to a different graph and press F4, you will repeat the last action performed on that graph.
- Customization of custom graphic objects (drawings, embedded objects)
- The general principles of selecting objects and accessing their customization facilities (summarized in the two previous paragraphs) also apply to all custom graphic objects such as drawings, arrows, and embedded objects. The Graph Tools toolbar buttons can also be used to access most of these customization facilities. For example, the buttons can be used to change the patterns, sizes, and colors of objects, and properties of predefined objects (such as arrows or error bars) or foreign objects (e.g., pasted, linked, or embedded artwork).
- Customization of linked or embedded OLE objects
- To edit OLE objects in Statistica graphs, double-click on the object; the source application will be opened in OLE server mode with the object displayed, allowing the object to be changed.
When the editing is completed, you can use any of the standard OLE conventions to exit the application's server mode and update the graph in Statistica (such as clicking on the Statistica Graph).


