Repeatability & Reproducibility Design - R & R Data Sheets Tab
Select the R & R data sheets tab of the Repeatability & Reproducibility Design dialog box to access the options described here.
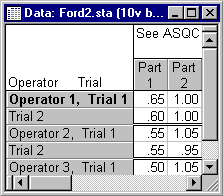
In this format, the data file (and spreadsheet) will contain no grouping variables. Instead, the design will be displayed (and shown) as a data sheet, where the columns represent the parts in the design, and the rows represent the operators and trials within operators.
- Standard gage R & R data sheet
- The Standard gage R & R data sheet group box contains two options: Summary: Display design and Save design. This format follows the gage repeatability and reproducibility data sheet shown in the ASQC/AIAG reference manual (ASQC/AIAG, 1991, page 124), and it is particularly suited when the data are collected and entered by hand, in which case the data sheet provides a convenient format for data entry. The data can then be entered directly into the STATISTICA data file following this format, and analyzed via the Process Analysis module.
- Summary: Display design
- Click the Summary: Display design button to display a spreadsheet that specifies the combinations of levels of the different factors in the study. The spreadsheet contains an extra blank column; thus, you can print the spreadsheet to produce a convenient data entry form.
- Save design
- Click the
Save design button to display the observed table in a standard R & R data sheet (shown in an individual window, regardless of the settings in the Options dialog box - Output Manager tab or the Analysis/Graph Output Manager dialog box). You can, however, add the spreadsheet to a workbook or report using the
 or
or
 buttons, respectively. Note that in order to save the spreadsheet, you must select the spreadsheet and then select
Save or
Save As from the File tab or menu.
Copyright © 2021. Cloud Software Group, Inc. All Rights Reserved.

