Example 10: Descriptive Statistics
This example provides a wide range of descriptive statistics that may be of particular interest if you suspect that the data for some variables are not normally distributed, and perhaps were measured on an ordinal (rank order) scale. For a discussion of these statistics and how they are computed, refer to Nonparametric Statistics Notes - Ordinal Descriptive Statistics. Note that detailed descriptive statistics, optionally broken down by one or more grouping variables, can also be computed with the Descriptive Statistics and Breakdown & one-way ANOVA options of the Basic Statistics module.
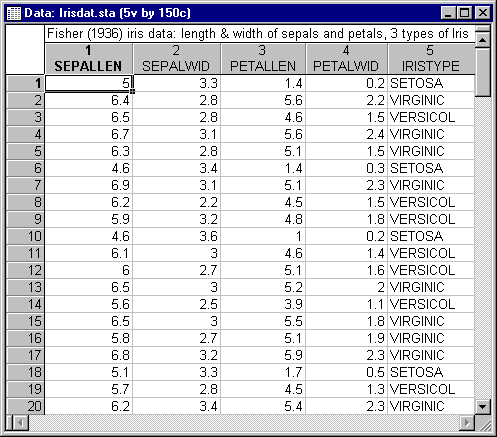
The example uses the data file Irisdat.sta (a partial listing is shown below), which contains data reported by Fisher (1936). It contains the lengths and widths of sepals (Sepallen, Sepalwid) and petals (Petallen, Petalwid) for 50 flowers of three types of iris. Open this data file via the File - Open Examples menu; it is in the Datasets folder.
- Specifying the analysis
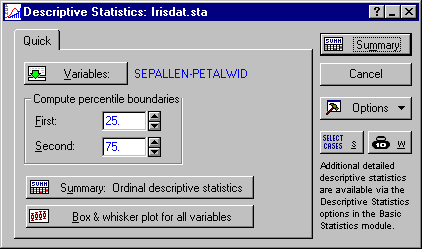
- Select Nonparametrics from the Statistics menu to display the Nonparametric Statistics Startup Panel. Next, select Ordinal descriptive statistics (median, mode, ...) on the Quick tab, and then click the OK button to display the Descriptive Statistics dialog. First, specify the variables; click the Variables button to display the standard variable selection dialog. Since Iristype is a coding variable to identify the type of iris, select only Variables 1-4, and then click the OK button.
- Reviewing the results
- Click the Summary button to begin the analysis and display the results (a partial listing of the Descriptive Statistics spreadsheet is shown below).
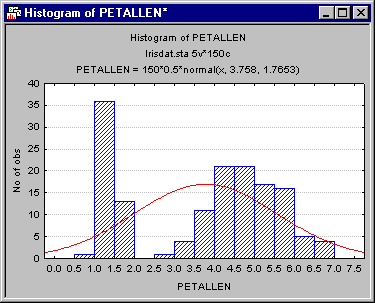
A common plot for this spreadsheet is a histogram of the frequency distribution with the normal curve superimposed. This plot is very useful for identifying deviations from the normal distribution. To produce this plot for variable Petallen, right-click on a cell in the Petallen row and select Graphs of Input Data - Histogram PETALLEN - Normal Fit from the resulting shortcut menu.
The histogram shows that variable Petallen is indeed multi-modal (as indicated in the results spreadsheet); it appears as if one group of observations forms a cluster on the left side of the plot.
See also, Nonparametric Statistics - Index. Note that detailed descriptive statistics, optionally broken down by one or more grouping variables, can also be computed with the Descriptive Statistics and Breakdown & one-way ANOVA options of the Basic Statistics module.


