Rectangles Button
Click the
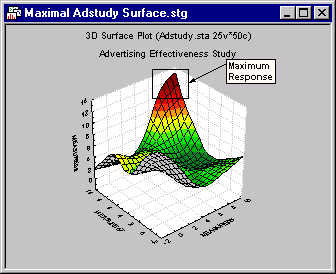
![]() button (or select Rectangle from the Insert menu) to draw a rectangle. When this button is clicked, the cursor changes into a cross-hair allowing you to draw rectangles by dragging the cross-hair on the graph.
button (or select Rectangle from the Insert menu) to draw a rectangle. When this button is clicked, the cursor changes into a cross-hair allowing you to draw rectangles by dragging the cross-hair on the graph.
- Drawing squares
- If you hold down the SHIFT key while drawing, a square is produced (equal height and width proportions are maintained).
- Exit
- To exit from the drawing mode, click the selection tool
 button or press ESC.
- Moving or redimensioning rectangles
- Click on the perimeter of a rectangle or square to select the object for moving or redimensioning. To move the object, place the mouse pointer inside the object and drag it with the left mouse button depressed. To redimension the object, drag the black selection squares that surround the object. If a rectangle or square needs to be aligned with other custom objects on the graph, consider using the Snap to Grid feature.
- Customizing properties of rectangles
- To further specify properties of newly created rectangles or to make changes to properties of existing rectangles, double-click on the perimeter of the object to display the Shape Object Properties dialog. You can use this dialog to specify line and fill patterns and colors as well as to define whether the anchor points (upper-left and lower-right corners) of the object are to be positioned in Dynamic or Fixed (the default) mode. In Dynamic mode, the corner (or corners) of the object will be positioned with respect to scale values of the graph axes. In this mode, the object will move if the scaling on the graph changes. In Fixed mode, the positioning will be with respect to the dimensions of the graph window and will not change if scale values change. See What is the difference between the dynamic and fixed status of custom objects in graphs?
Copyright © 2021. Cloud Software Group, Inc. All Rights Reserved.

