Calculated Graph Data
Select Calculated Graph Data on the Graph Data Editor shortcut menu or the Graph Data Editor Layouts menu to display the Calculated Graph Data display spreadsheet. This spreadsheet shows the actual values that are plotted in the respective graph, in the respective plot. When the plotted values (actual plot points in the graph) are identical to the data that are being plotted, then the Calculated Graph Data spreadsheet is not available (because the values would be identical to those in the Graph Data Editor). Note also that the values displayed in the Calculated Graph Data spreadsheet cannot be edited (changed).
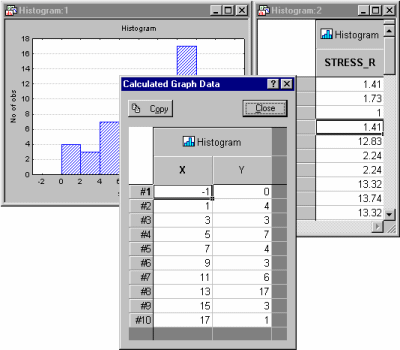
Thus, the Calculated Graph Data spreadsheet displays the values for the plot points shown in the graph, after performing the calculations, aggregation, etc. on the graph data, given the respective type of plot. For example, suppose you created a histogram. Next, display the Graph Data Editor, for example by clicking on the graph and choosing Graph Data Editor from the shortcut menu. Then, with the Graph Data Editor active, select Calculated Graph Data - Plot 1 from the Layouts menu. You now have the following three windows on the screen.
The histogram is made up of 10 columns; they summarize the raw data for variable Stress_r, as shown in the Graph Data Editor to the right. The Calculated Graph Data spreadsheet shows the actual counts for each category depicted in the histogram, i.e., the actual plot points.

