Example 9: Cochran Q Test
The Cochran Q test is an extension of McNemar's Chi-square test to more than two dependent samples. This test can also be considered to be an alternative to one-way within-subjects (repeated measures) analysis of variance (see the ANOVA and GLM modules) when the dependent variable is dichotomous in nature. This test is also applicable when you want to test changes in proportions at different times in the same sample. For a discussion of the logic and assumptions of this test, see Nonparametric Statistics Notes - Cochran Q Test.
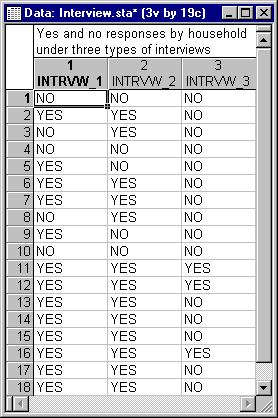
This example is based on a (fictitious) data set reported in Siegel and Castellan (1988, page 173). Suppose that you are interested in investigating the effect of interviewing style on the number of respondents who agree to answer personal questions in face-to-face surveys. For example, it is always most difficult to get responses concerning personal finances or health in this type of survey, and you might want to learn whether interviewing style improves the response rate (non-refusals) to such personal questions. For that purpose, you could train an interviewer to conduct the interview in either 1) an enthusiastic manner, being friendly and showing interest (Interview 1), 2) a very reserved and formal manner (Interview 2), or 3) in a disinterested and abrupt manner (Interview 3). You could then select 18 sets of three households that are carefully matched in their responses to previous surveys, and randomly assign the three households in each set to one of the interviewing styles. As the dependent variable, you record whether the respective interviewee does (1-Yes) or does not (0-No) answer the personal questions. The results of this study are recorded in the Interview.sta data file. Open this file via the File - Open Examples menu; it is in the Datasets folder.
- Specifying the analysis
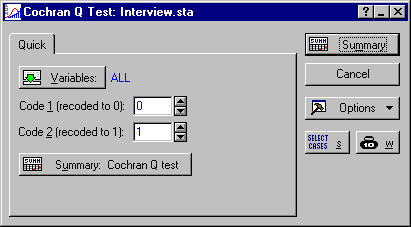
- Select Nonparametrics from the Statistics menu to display the Nonparametric Statistics Startup Panel. Next, select Cochran Q test from the Quick tab and click the OK button to display the Cochran Q Test dialog. Specify the variables to be compared; click the Variables button to display the standard variable selection dialog. Here, select all 3 variables and then click the OK button.
- Reviewing the results
- Click the Summary button to begin the analysis and display the results.
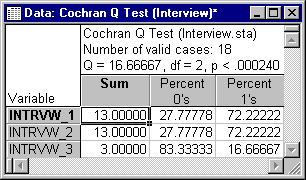
The Q test is highly significant. The right-most column shows the percent of households that disclosed personal information (Percent 1's). Interestingly, there is no difference in the effectiveness of the interested, enthusiastic style (Variable Intrvw_1) and the formal, courteous style (Intrvw_2), so interviewer interest does not seems to matter. However, refusals increased when the interviewer acted disinterested and abrupt (Intrvw_3).
A quick visual summary of these results can be obtained by producing a box plot. Select Box Plots from the Graphs - 2D Graphs menu to display the 2D Box Plots dialog. On the Quick tab, click the Variables button to display the standard variable selection dialog. Here, select all three variables as the Dependent variable and then click the OK button to return to the Quick tab. Next, select Multiple as the Graph Type, and in the Middle point group box, select Mean in the Value box. Note that when you do this, the preview graph on the Quick tab changes so you can see that you will be producing a Mean/SE/SD box plot. Then, click on the Advanced tab, and in the Outliers group box, select Off. Finally, click the OK button in the 2D Box Plots dialog to produce the following plot.
See also, Nonparametric Statistics - Index.


