PI Asset Framework Data
Statistica allows you to define data to bring in through the PI Asset Framework. It is available on the Statistica ribbon menu and as a node.
It allows you to:
- Select a PI server that supports the asset framework
- Select PI databases within those servers
- Navigate through the hierarchies within the selected PI database to select assets
- Select a specific asset within the hierarchies that have been configured in the Asset Framework to be queried and display the attributes defined for those assets.
- Select one or more of those attributes that are displayed and enable query information on any that the system will allow to be queried.
- Preview the data
- Return the data into a Statistica Spreadsheet
- Record a master macro that can recreate the results of the query.
The Asset Framework Data Node has two tabs: Specifications and Home.
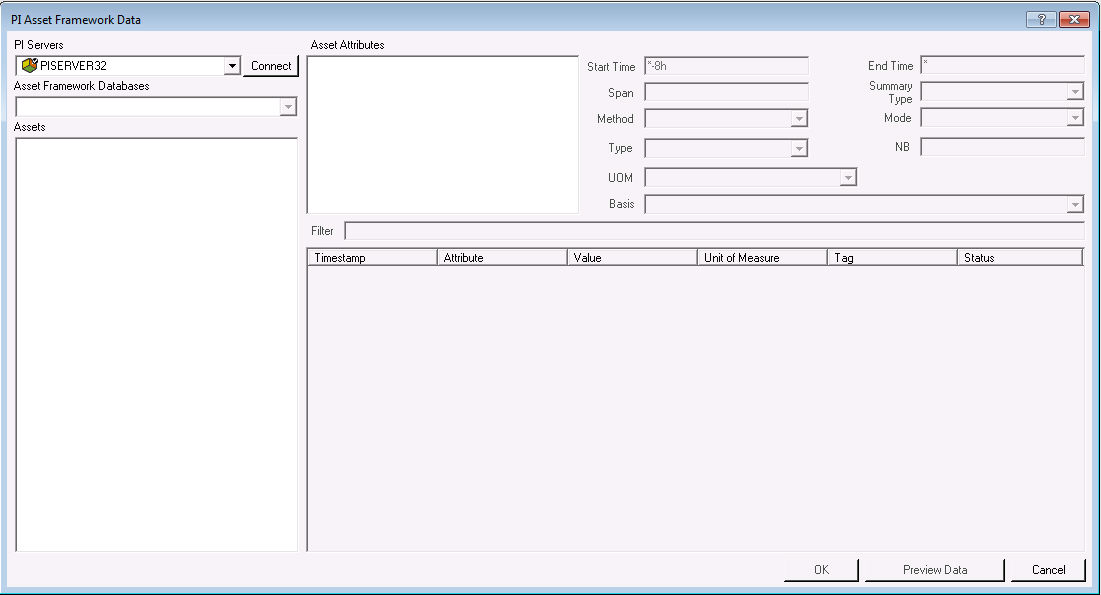
PI Servers
Select the PI Server you want to use from this dropdown list to change servers. If you have previously connected, your connection will persist for the current Statistica instance.
Asset Framework Databases
Select an Asset Framework Database in the selected PI server from this drop down list.
Assets
The elements of your selected Asset Framework Database display in a tree view with folders, subfolders and assets. Clicking on an asset displays its attributes in the Asset Attribute list box.
Assets Attributes list box
This box lists selected assets. Attributes can be selected by clicking the respective Attribute. Multiple selections can be made by selecting separate Attributes. Once selected, and Attribute needs to be selected again to deselect it. Information for you to query on an attribute is determined by which parameters are enabled and which Method is selected.
Unit of Measurement (UOM)
Select a Unit of Measure for the selected asset from the drop down list displaying the available UOMs with their abbreviations in parenthesis.
Span
Specify the sample interval.
- If specified in hours, minutes, seconds, or milliseconds, the time intervals will be evenly spaced UTC time intervals.
- If specified in a longer interval, the interval types are interpreted using wall clock rules and are time zone dependent.
Example: A span interval created with the string 24h means using an evenly spaced 24 UTC hour interval between each event
Example: A span interval created with the string 1d would return an interval shorter or longer than 24 hours if the interval encompasses a Daylight Savings Time change.
- When a positive interval is specified, the interval calculation begins at the earliest bounding time in the Span and applies the interval repeatedly in time ascending direction to generate the calculation intervals.
- When a negative interval is specified, the interval calculation begins at the latest bounding time in the Span and applies the interval repeatedly in time descending direction to generate the calculation intervals.
The order of values returned will still be reflected by the Span, regardless of the interval sign
Recorded Value
This Method returns the timestamp, attribute, value, unit of measure, optional tag, and data status for the attribute, using the start time to define the time, unit of measure to define the output units of measure, and mode to determine the value to return when a value does not exist at the exact time specified
Recorded Values
This Method returns multiple timestamps, attributes, values, units of measures,optional tags, and data status for the attribute, using the start and end time to define the time range, the unit of measure to define the output units of measure, and the type to determine how the times and values of the returned end points are determined.
Interpolated Value
This Method returns the timestamp, attribute, value, unit of measure, optional tag, and data status for the attribute using the start time to define the time and unit of measure to define the output units of measure.
Interpolated Values
This Method returns multiple timestamps, attributes, interpolated values, units of measure, optional tag, and data status for the attribute, using the start and end time to define the time range and using the span to define the interval of the time range.
Summary Value
This Method returns a timestamp, attribute, summary type, value, possible unit of measure for the attribute, possible tag, and data status, using the start and end time to define the time range, summary type (which specifies a summary to compute for each interval over the time range), and basis to specify the method of evaluating the data over the time range.
- Count and PercentGood are the only summary types supported on non-numeric attributes.
- Time-weighted totals are computed by integrating the rate tag values over the requested time range.
Plot Values
This Method returns multiple time stamps, attributes, values, units of measure, possible tags, and data status for the attribute, using the start and end time to define the time range, unit of measure to define the output units of measure
- NB must be greater than 1
- NB must be less than or equal to 100000
Generic
This Method returns multiple timestamps, attributes, values, units of measure, possible tags, and data status for the attribute using the start and end time to define the time range, unit of measure to define the output units of measure.
- NB can be unspecified
- NB, when specified, must be less than or equal to 100000
Type
This option is available for Recorded Values, and allows selection of Inside, Outside, or Interpoled values
Basis
When Summary Value is selected, the Basis allows selection of how the Summary will be calculated.
Summary Type
The summary type is an enumerated value used to determine a summary to compute for each interval over the time range.
Count
This is the sum of event count over the time range when calculation basis is event weighted. The sum of event time duration over the time range when calculation basis is time weighted.
Percent Good
This is the percent of data with good value during the calculation period. For time weighted calculations, the percentage is based on time. For event weighted calculations, the percent is based on event count
All For Non Numeric
A convenience for requesting all available summary calculations for non-numeric data.
Mode
The Mode is an enumerated value used to determine the value to return when a value does not exist at the exact time specified.
AtOrBefore
This Mode returns a recorded value at the passed time, or if no value exists at that time, the previous recorded value.
AtOrAfter
This Mode returns a recorded value at the passed time, or if no value exists at that time, the next recorded value.
NB (Intervals / Maximum number of points)
The NB is a value used to define the number of intervals or points to return.
- For the summary type of Plot Values the value defines the number of points to return. The number of points must be greater than 1 and less than or equal to 100000
- For the summary type of Generic the number of points must be greater than and less than or equal to 100000
Filter
Enter a string containing a filter expression. Expression variables are relative to the attribute. A null or empty string indicates no filtering. If the attribute does not support the option filter, the filter will be ignored as if not specified.
The columns in the Preview area are listed below:
A list containing the results of the method query executed when the preview data button is clicked. The columns included in the preview will depend of the attribute:
| Method | Columns |
| Recorded Value | timestamp, attribute, value, unit of measure, source tag, and status. |
| Interpolated Value | timestamp, attribute, value, unit of measure, source tag, and status |
| Summary Value | summary type, attribute, timestamp, value, unit of measure, source tag, and status |
| Generic | timestamp, attribute, value, unit of measure, source tag, and status |
| Plot | timestamp, attribute, value, unit of measure, source tag, and status |
The following information on the points are returned:
Results: Spreadsheet
The column names will be the same as the columns in the previewed data.
The full name of the asset will be included in the Spreadsheet Header. (Server, name of the asset framework database, names of the asset hierarchy) If a filter is defined it is applied to all data,
Workspace Node
Available through Asset Framework Data ribbon bar button on PI tab. Its parameters dialog has the same options as the interactive dialog described above.
The workspace node will produce a downstream document for other Workspace nodes to use. The settings for the node are saved with the Workspace.
Upstream Data Source
If the workspace has an upstream data source, the data source will override dialog settings, and each case of the upstream data source will be processed separately, appending the results to the final downstream Spreadsheet.
The upstream data source must be specially formatted to have one or more variables that map to the names of the controls on the PIAF dialog and define the query.