Example 1: Styles that Apply to the Entire Graph
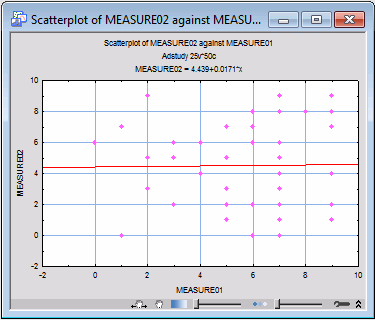
If a variety of customizations have been applied to a graph using the options in the Graph Options dialog box, the graph style can be saved and then applied with new data to completely reproduce the appearance of the customized graph. As an example, use the Adstudy.sta file to create a 2D scatterplot with the default linear fit applied from the Graphs menu (Measure01 and Measure02 were used in the graph below).
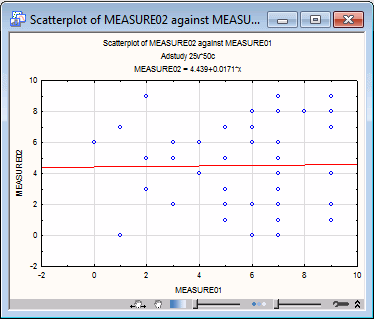
- Next, double-click on the graph background (i.e., outside the graph axes) to display the Graph Options dialog box. On the Graph: Window tab, change the Outside Background Color to light gray.
- On the Plot: General tab, change the point marker color and type by clicking the Markers button. Select the solid diamond shaped marker type, and set the marker color to pink.
- Finally, on the Axis: Major Units tab, change (for both the X and Y axes) the Gridlines to a solid blue line of width 1.5 points.
- Click the OK button to redraw the graph.
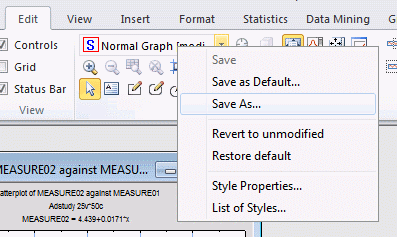
- to display the Save As dialog box, and give the style a distinctive or descriptive name (e.g., Pink Diamonds).
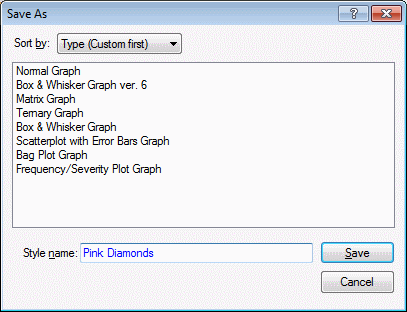
The saved graph style incorporates both the creation and customization features of the graph.
- Now display a new 2D Scatterplot creation dialog box by selecting Scatterplot from the Graphs tab, and select the Appearance tab.
- Use the Use graph style box to select the newly defined style (Pink Diamonds).
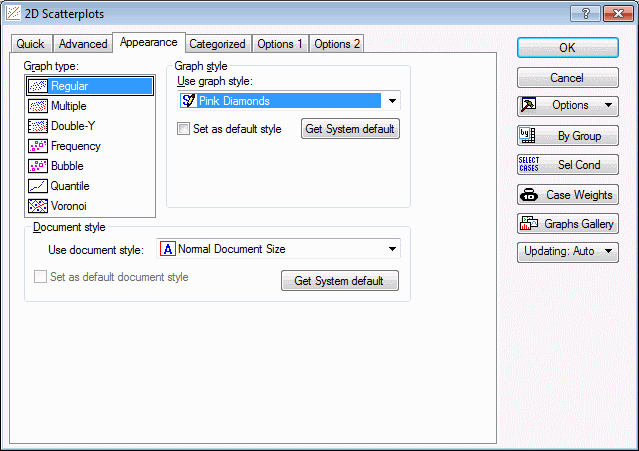
When you click the OK button, STATISTICA will prompt you to select variables for the graph, and then will produce a new scatterplot with the background colors, marker shape and color, and gridline type, thickness, and color defined by the saved style.
Note also that a graph style specified in the Use graph style box on the Appearance tab of a graph creation dialog box will be saved with the graph creation specifications if the graph is saved as a user-defined graph via the Add As User-defined Graph to Menu button on the Options 2 tab of the graph creation dialog box.

