Recording Analysis Output
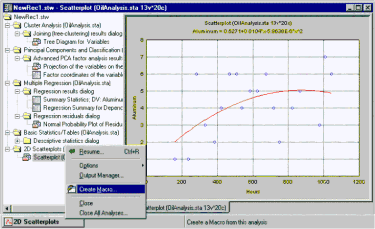
This is a typical example when this type of macro recording is extremely useful. Suppose you are performing an exploratory analysis, applying different statistical techniques, and looking at different graphs, etc. At some point, you create a scatterplot that is particularly revealing and interesting by selecting Scatterplots from the Graphs menu. You would like to "remember" and document exactly how you created that particular graph, so you select Create Macro from the shortcut menu (displayed by right-clicking on the analysis button) to record everything that you have done in this particular analysis (e.g., via Graphs - Scatterplots).
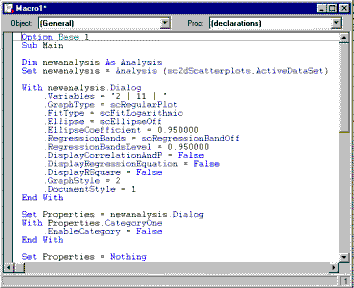
The macro that is recorded will reflect all settings for this particular analysis. In other words, it will not record any multiple regression analyses you may have run or other graphs you have made. It will record only the settings and selections for this particular analysis (Scatterplots). The recorded macro may look like this:
As you can see, the recording started with this particular analysis, by creating a new analysis object for the 2D scatterplot. If you run this macro, the exact same graph will be produced; thus, you can save the macro, perhaps with some comments and annotations, to be included in a final report or to be run repeatedly on different data files with similar variables.


