Correlations in Non-homogeneous Groups
A lack of homogeneity in the sample from which a correlation was calculated can be another factor that biases the value of the correlation.
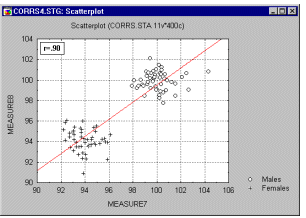
Imagine a case where a correlation coefficient is calculated from data points that originated from two different experimental groups, but this fact is ignored when the correlation is calculated. Assume that the experimental manipulation in one of the groups increased the values of both correlated variables, and thus the data from each group form a distinctive cloud in the scatterplot (as shown in the graph below).
In such cases, a high correlation may result that is entirely due to the arrangement of the two groups, but which does not represent the true relation between the two variables, which may practically be equal to 0 (as seen when looking at each group separately). See the following graph.
If you suspect the influence of such a phenomenon on your correlations and know how to identify such subsets of data, try to run the correlations separately in each subset of observations.
For example, you could use the Breakdowns option or the Categorized Scatterplots option. If you do not know how to identify the hypothetical subsets, try to examine the data with some of the exploratory multivariate techniques offered in Statistica (for example,Cluster Analysis).
Copyright © 2021. Cloud Software Group, Inc. All Rights Reserved.


