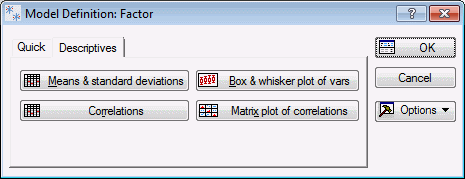
Descriptives Tab
Select the Descriptives tab of the Canonical Analysis Model Definition dialog box to access the options described here.
| Element Name | Element Type | Description |
|---|---|---|
| Means & Standard Deviations | Button | Displays a spreadsheet with the means and standard deviations for all variables (selected from the Startup Panel). A particularly useful Graph of Input Data for this spreadsheet is the histogram of the frequency distribution for the respective variable. That plot will also indicate the normal distribution, so it may serve as a quick visual check for any violations of the normality assumption. |
| Correlations | Button | Displays a spreadsheet with the correlation matrix for all variables (selected from the Startup Panel). A particularly useful Graph of Input Data for this spreadsheet is the scatterplot of the respective two variables that are highlighted. |
| Box & Whisker Plot of Vars | Button | Upon clicking this button, selecting variables from the resulting Select Variables dialog box, and selecting an option from the Box-Whisker Type dialog box produces a box and whisker plot (showing medians and quartiles, means and standard deviations, etc.) for selected variables. |
| Matrix Plot of Correlations | Button | Produces a scatterplot matrix for selected variables. |
Copyright © 2021. Cloud Software Group, Inc. All Rights Reserved.

