Review Descriptive Statistics - Quick Tab
Select the Quick tab of the Canonical Analysis Review Descriptive Statistics dialog box to access the options described here.
| Element Name | Element Type | Description |
|---|---|---|
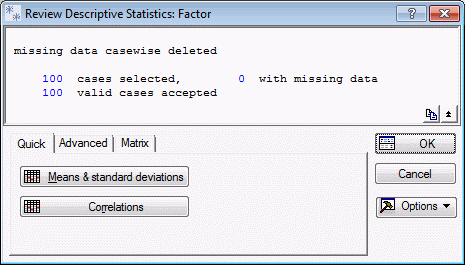
| Means and standard deviations | Button | Displays a spreadsheet with the descriptive statistics for the variables in the analysis. If a raw data file is analyzed (i.e., raw data was specified on the Canonical Analysis Startup Panel - Quick tab) a particularly useful Graph of Input Data for that spreadsheet is the histogram with fitted normal distribution. |
| Correlations | Button | Displays a spreadsheet with the current correlation matrix. If a raw data file is analyzed, (i.e., raw data was specified on the Canonical Analysis Startup Panel - Quick tab) a particularly useful Graph of Input Data for that spreadsheet is the scatterplot with the fitted regression line. |
Copyright © 2021. Cloud Software Group, Inc. All Rights Reserved.