Example 1: Aligning Data From a Cyclone Furnace
This example is based on a typical application of the Statistica Extract, Transform, and Load (ETL) module to the analysis of process data describing the operation of a coal furnace, as widely used for power generation. Specifically, the data describe the operation of a 5-cyclone unit. Cyclone furnace technology was developed in the 1940's, and built through the 1960's. In short, crushed coal is blown into a barrel, where the actual combustion process takes place. An advantage of this technology is that it can burn coal of poor quality, and with high moisture content. However, with this technology it is difficult to achieve low NOx and CO emissions, as required by modern clean air standards.
Power Solutions
Specifically devoted to solve emissions and reliability issues in power generation – has extensive experience in the analysis of historical power plant data, to optimize process performance (for low emissions, LOI, consistent and efficient operations, etc.). The present example is based on a (slightly modified) set of data files describing the operation of a 5 cyclones of a cyclone-based unit.
Most power plants in the U.S. record hundreds, if not thousands of parameters describing the operations of their plant in great detail in to a process historian. Often, OSIsoft's PI System database is deployed to store data with great accuracy, and at 1-minute intervals. Statistica Enterprise-based solutions can be fully integrated with PI (and other process historians), so that the process of extracting and aligning data from multiple data sources can be completely automated.
It is not uncommon that the process historian contains detailed records on hundreds, even thousands of process parameters, minute-by-minute. As a result, to analyze, for example, a full year of process data results in substantial data volumes. However, using the appropriate methods available throughout the Statistica system (for example, Statistica Process Optimization), useful results can quickly be extracted from such large data sets, for the purposes of 1) root cause analysis (such as finding causes of process problems), 2) multivariate process monitoring (simultaneously monitoring complex operations), and 3) process optimization (such as optimization for low NOx and CO operations).
This example is based on process data that were extracted from an OSIsoft PI System database for the purposes of optimizing cyclone performance for consistent flame temperatures over a wide range of load conditions (details are also available from Electric Power Research Institute or EPRI). This example illustrates how to use the Statistica Extract, Transform, and Load (ETL) module to align multiple data sources, to create a single (aggregated and aligned) data file suitable for subsequent analyses.
Other use cases that can be built from the methods illustrated in this example include the creation of process monitors, where complex data from multiple sources are extracted (automatically, for example, with Statistica Enterprise) for the purpose of creating summary (daily) reports based on aligned and validated data.
Data Set
This example is based on the example data files Cyclone-1.sta, Cyclone-2.sta, Cyclone-3.sta, Cyclone-4.sta, and Cyclone-5.sta, which are included with Statistica. Each data file contains data for one of 5 cyclones of a coal burning power generating station.
Each data file contains one date-time stamp variable, and 12 other variables that measure the operating characteristics of the cyclone.
Objective
The data describing the operations of the power plant resided in multiple files (one file for each cyclone). To allow for a meaningful analysis across all cyclones, the data need to be merged into a single file that is aggregated and aligned by the date-time stamp, such that each case represents simultaneously the operational characteristics of all 5 cyclones at the given time.
Starting the analysis
- Select the File tab.
- Click External Data.
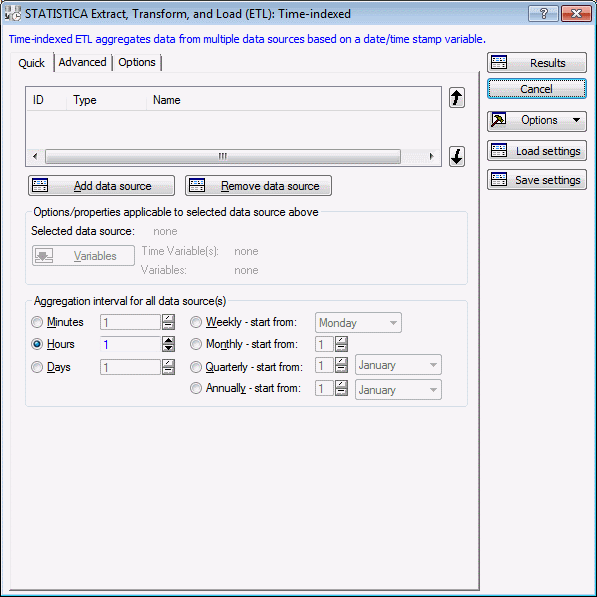
- Under the Extract, Transform, and Load (ETL) heading, click Time-indexed Process Data.
- Select the
Advanced tab.
Options from the Quick tab plus other less commonly used options display. The grid at the top of the tab lists the data sources and their associated properties such as data source ID (for recording/editing SVB macros), data type, and name. You can use the arrows to the right of the grid to change the sequence in which the data sources are aligned/merged.
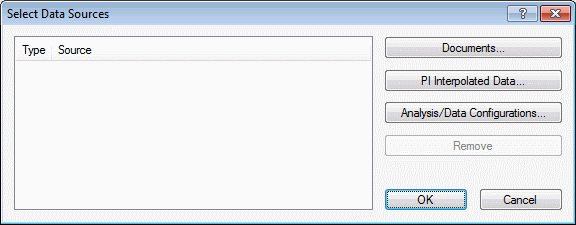
- Click the Add data source button. The Select Data Sources dialog box is displayed.
- Click the Documents button. The Select Documents dialog box is displayed.
- Click the Files button. The Open dialog box is displayed.
- Browse to the location of your Statistica installation for example, C:\Program Files\Statistica\Statistica *\Examples\Datasets.
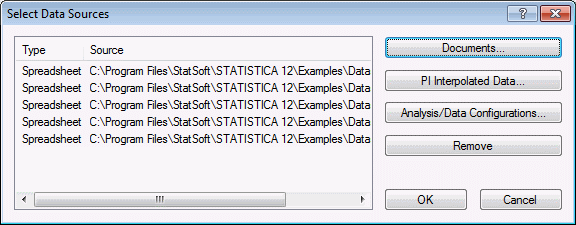
- While pressing the Shift key on your keyboard, select data files Cyclone-1.sta, Cyclone-2.sta, Cyclone-3.sta, Cyclone-4.sta, and Cyclone-5.sta
- Click the Open button.
- Click the OK button in the Select Data Sources dialog box.
- The selected files are added to the analysis.
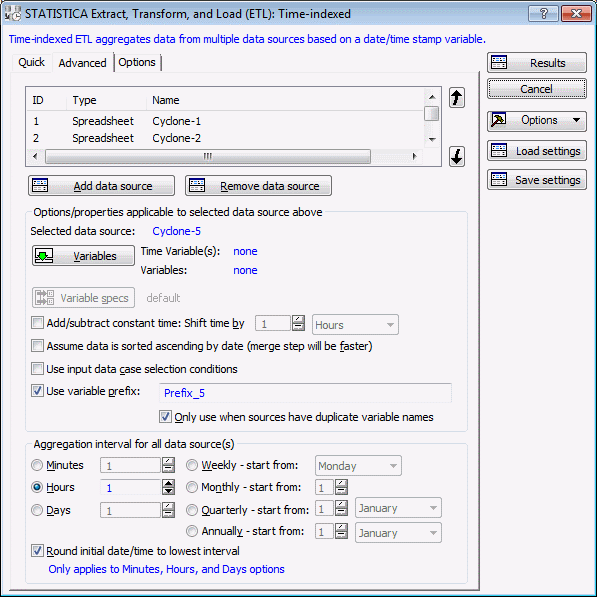
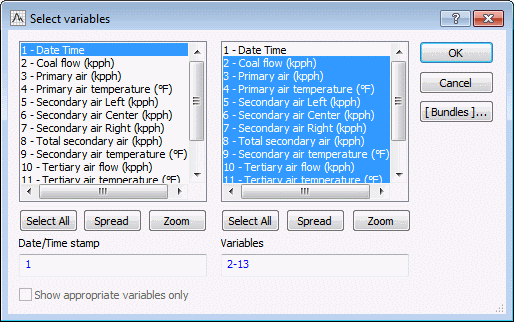
- Select Cyclone-1 in the list at the top of the grid, and click the Variables button. The Date/Time stamp variable and other variables to be included in the output file are defined.
- Select variable 1-Date Time from the first list and all other variables from the second list.
- Click the OK button.
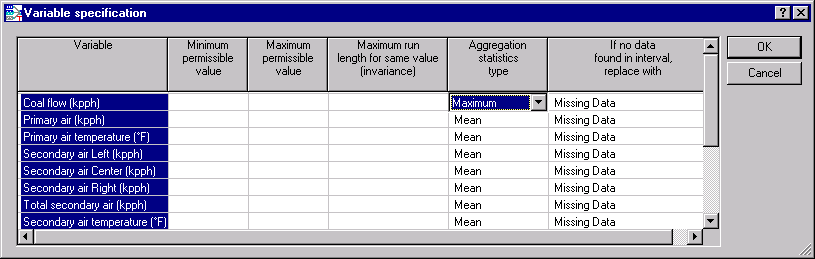
- On the Advanced tab of the Startup Panel, click the Variable specs button. The variable specifications for the selected variables are specified.
- For Coal flow (kpph), select Maximum in the Aggregation statistics type column. Leave all other specifications at their defaults.
- Click the OK button.
- Select Cyclone-2.sta from the list of files, click the Variables button, and select the variables from the variables list.
- Select variable 1 for Date/Time stamp and 2-13 for the Variables in second list.
- Click the OK button.
- Repeat the same variable selection for Cyclone-3.sta, Cyclone-4.sta and Cyclone-5.sta .
- Scroll the list to see all the files in the list view.
- In the Aggregation interval for all data source(s) group box, select the Days option button.
- Click the Results button.
- The aggregated and aligned results spreadsheet is created.


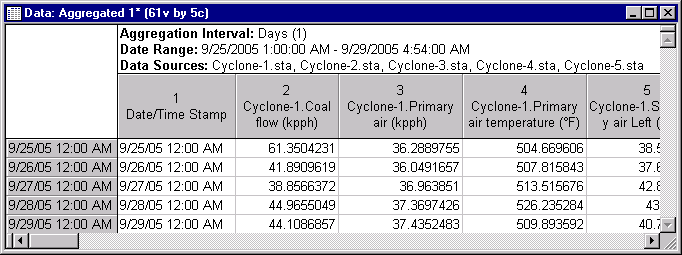
The resultant spreadsheet contains 5 cases and 61 variables (the date-time stamp variable plus 12 variables from each cyclone file). Each variable shows the respective aggregation statistics that were defined in the variable specs. By default means are collected for continuous variables, and the mode for categorical variables.
For variable Coal flow (kpph), the statistic computed and reported is the maximum for the respective interval. Looking at case 1, the value 61.3504231 is the maximum value found in file Cyclone-1.sta for the date-time range from 9/25/2005 12:00 AM (inclusive) to 9/26/2005 12:00 AM (exclusive). For all other variables, the mean is computed for the respective range.
This resultant file can be used for further analysis, or using Statistica Enterprise, these data could be used for standard reporting, or written back to a standard database as part of an automated ETL application.