How can I create a blank graph, and set data directly into the graph?
Practically all graphics options of Statistica are directly accessible via SVB; this makes SVB a very powerful graphics programming language. The following program shows how to create a blank 2D graph, set some data into the graph, and add an arrow.
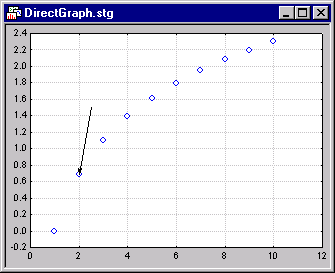
Option Base 1 Sub Main
Dim i As Integer Dim g As New Graph Dim gl As Layout2D ' Make a graph object with content. Set gl = g.GraphObject.CreateContent(scg2DGraph) ' Make room for 10 data points. gl.Plots.Add(scgSimplePlot,10) ' Make the data. For i = 1 To 10 gl.Plots(1).Variable(1).Value(i)=i gl.Plots(1).Variable(2).Value(i)=Log(i) Next i ' Let us add an arrow to this graph. Dim x(2) As Double, y(2) As Double ' Point to location.. x(1)=2 y(1)=Log(2) ' Point from location... x(2)=2.5 y(2)=1.5 g.ExtraObjects.AddDynamicArrow(x(1),y(1),x(2),y(2)) ' Finally make the graph visible. g.Visible=True End Sub
You can further customize all aspects of this graph from within the SVB program; review the different properties and methods that apply to the various graphics objects in the
![]() Object Browser.
Object Browser.