Example 2: Kaplan-Meier Product-Limit Estimates
The life table method is the oldest and most commonly used technique for estimating the survival function (and the hazard and probability density functions). However, the exact estimates from the life table depend on the choice of the number and widths of survival time intervals. The Kaplan-Meier product-limit method estimates the survival function directly from the survival times, without tabulation. The Introductory Overview explains the general computational approach of this method. In this example these estimates are computed for the example datafile Heart.sta. See Survival Analysis Examples - Overview and Data File for a description of this data file.
Specifying the Analysis
- Select Survival Analysis from the Statistics - Advanced Linear/Nonlinear Models menu to display the Survival and Failure Time Analysis Startup Panel. Double-click Kaplan & Meier product-limit method. The Product-Limit (Kaplan & Meier) Analysis dialog box is displayed in which you can select the variables with the survival times, the censoring variable, and the censoring codes.
- Click the Variables button to display the standard variable selection dialog box. Here, select the first 6 variables as the Survival times (or dates). Statistica interprets the first and fourth variable in the list as months, the second and fifth as days, and the third and sixth as years. Next, specify variable Censored as the Censoring indicator variable in the variable selection dialog and then click OK.
- Double-click in the Code for complete responses field to display the Variable 7 dialog box. Here, select Complete and click OK. In the same manner, double-click the Code for censored responses field and select Censored.
- Click OK to begin the analysis.
Reviewing the Results
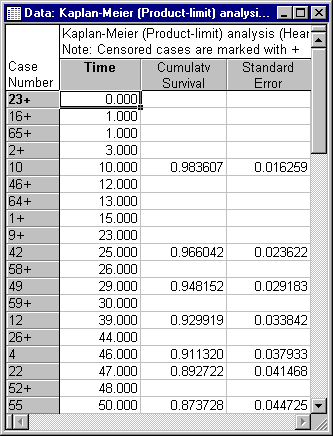
From the Product-Limit (Kaplan-Meier) Analysis Results dialog box, click the Summary: Product-limit survival analysis button to review the estimates of the survival function. Note that censored observations in this table are marked by a plus (+) sign.
You can plot the estimated survival function by the Survival times vs. cum. proportion surviving button.
The characteristics of this particular function now seem much clearer than before: The survival function drops off sharply during the first 100 or so days after the heart transplant. Thereafter, the distribution declines much less sharply. Therefore, you can conclude that the first 100 days after the transplant are the most critical to survival.
Percentiles
Click the Percentiles of survival function button on the Advanced tab to compute these percentiles and display them in a spreadsheet.
These percentages again reflect the nature of the distribution. Twenty-five percent of all patients die within the first 64 days after the transplant (note that the Survival Analysis module interpolates values to estimate the percentiles). Fifty percent of all patients survive longer than 679 days. The 75th percentile cannot be computed from these data because only censored observations show very long survival times (see the survival table shown earlier).


