MQC Charts Example 5 - Creating a Multivariate CUSUM Chart
- Overview
- This example is based on the data file ThreeQualityCharacteristics.sta. The data contains three quality characteristics for a certain product measured at regular time intervals for monitoring and quality control.
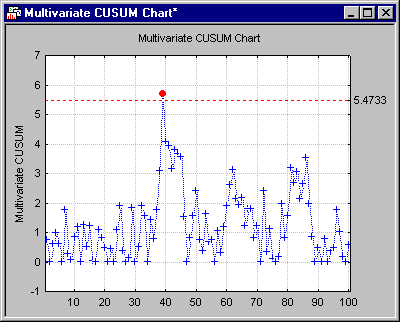
The Multivariate Cumulative Sum (MCUSUM) chart is a generalization of the univariate CUSUM chart. Instead of tracking the cumulative sum of deviations of successive observations from a standard or mean, in this chart, a single statistic is charted that tracks the multivariate cumulative sum of deviations (of individual points) from a vector of means (or a multivariate standard).
Specifying the analysis.
Ribbon bar. Open the data file by selecting the Home tab. In the File group, click the Open arrow and select Open Examples to display the Open a Statistica Data File dialog. The data file is located in the Datasets folder.
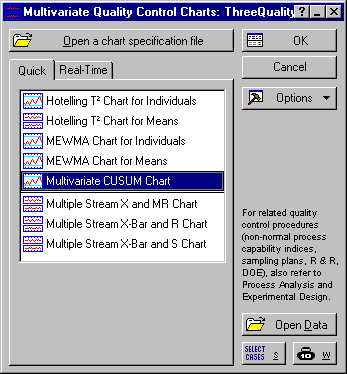
Then, select the Statistics tab. In the Industrial Statistics group, click Multivariate to display the Multivariate Quality Control Charts Startup Panel.
- Classic menus
- Open the data file by selecting Open Examples from the File menu to display the Open a Statistica Data File dialog. The data file is located in the Datasets folder.
Then, from the Statistics - Industrial Statistics & Six Sigma submenu, select Multivariate Quality Control to display the Multivariate Quality Control Charts Startup Panel.
Select Multivariate CUSUM Chart on the Quick tab. Click the OK button to display the Defining Variables for Multivariate CUSUM chart dialog. On the Quick tab, click the Variables button, and in the variable selection dialog, select variables 1-3.
Click the OK button to close the variable selection dialog. In the Defining Variables for Multivariate CUSUM chart dialog, click OK to run the analysis.
Sample 39 seems to indicate an out of control condition.
To create a spreadsheet of the descriptive statistics, in the Results dialog, click the Descriptives button on the Charts tab.


