Customization of Graphs
Interactive graph customization
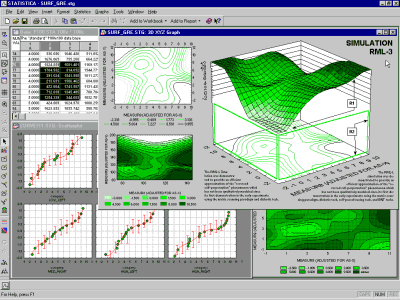
The customization options in Statistica graphics include hundreds of features and tools that can be used to adjust every detail of the display and associated data processing. However, these options are arranged in a hierarchical manner, so those used most often are accessible directly via shortcuts by double-clicking or right-clicking on the respective element of the graph.
- Support for F4
- To simplify the process of editing graph display features (e.g., font color, point markers, area patterns), Statistica provides support for the F4 key on your keyboard. This means that you can repeat the last command you performed in the graph. For example, if you have just changed the title font to Arial, 12pt, Italic and you want to make the same change to the axis titles, simply highlight the axis title you want to update, and press F4. Note that the F4 buffer is graph specific. If you switch to a different graph and press F4, you will repeat the last action performed on that graph.
Permanent settings and automation options
The initial (default) settings of all of these features can be easily adjusted so that even the default appearance and behavior of Statistica graphs will match your specific needs and/or will require very little intervention on your part. There are at least four different ways to make these adjustments:
- Options dialog box
- Perhaps the most straightforward way to adjust the default appearance of graphs isby using the options in the Documents/Graphs: Display and Documents/Graphs: Settings tabs of the Options dialog box (accessible via the Tools tab or menu). Most commonly used settings can be easily adjusted here, and the results will be reflected in the default styles (see point 2 below) that will be used by the system and as such, theywill be automatically saved in the Statistica configuration file (e.g., different settings can be used for different projects). For further details, see the Configurations tab of the Options dialog box (accessible from the Tools tab or menu).
- Graph style system
- All of the numerous features that affect the appearance of the graph (from as element aryas the color of the font in the footnote to as general as the global features of the graph document) can be saved as individual "styles." These styles can be given custom names and later be reapplied using simple shortcuts (such as pressing a specific key combination or clicking a button on a custom toolbar). An intelligent system internally manages these thousands of styles and their combinations in Statistica and helps you achieve your customization objectives with a minimum amount of effort. All user-defined or modified styles will be saved automatically in the Statistica configuration file (e.g., different sets or systems of styles can be used for different projects). For information on saving configurations of Statistica, see the Configurations tab of the Options dialog box (accessible from the Tools tab or menu).
- User-defined graphs
- New types of graphs can be defined in a variety of ways and they can be added to the menus, dialogs, or toolbars. If a custom graph that you intend to use repeatedly is not built "from scratch" (e.g., drawn using the graphics primitives) but is based on one of the Graphs menu graphs and is produced by some combination of the existing graph customization options, then adding it to the Graphs menu as a new type of graph is as simple as clicking the Add As User-defined Graph to Menu button in the Options 2 tab of the graph definition dialog. All user-defined graph specifications will be saved automatically in the Statistica configuration file (e.g., different sets of custom graphs can be used for different projects). For further details, see the Configurations tab in the Options dialog box (accessible from the Tools tab or menu).
- Statistica Visual Basic
- Finally, note that there are no limits to how deeply customized your Statistica custom graphs can be, because Statistica Visual Basic (with all its powerful custom drawing tools as well as the Statistica-based library of graphics procedures) can be used to produce virtually any graphics or multimedia output supported by the contemporary computer hardware. Those custom developed displays or multimedia output can be assigned to Statistica toolbars, menus, or dialog boxes and become a permanent part of your Statistica application.
There are various methods to request Statistica graphs. You could say that these methods represent different types of "interfaces" between numbers and graphs.
For example, the numbers represented in a pie chart can simply depict values of a spreadsheet column (e.g., variable Sales) in the consecutive cases of the spreadsheet (e.g., cases labeled: Year 2002, Year 2003, Year 2004, ..., etc.). The numbers in a similar pie chart, however, can also represent results of some calculations. For example, the slices of the pie can represent relative frequencies of observations that belong to certain categories calculated by one of the histogram or frequency categorization procedures (e.g., numbers of years when the Sales were below $10 million, between $10 and $20 million, and above $20 million).
Regardless of the method used to create a graph (i.e., regardless of where the numbers represented in the graph were obtained or how they were calculated), all Statistica graph customization and multigraphics management facilities can be used to change the appearance of the graph or integrate it with other graphs or documents.
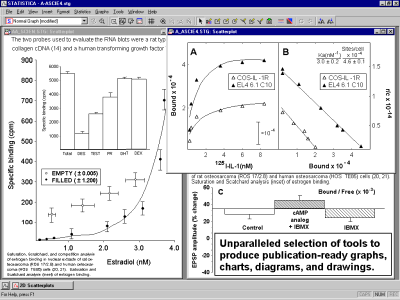
Also, all integrated analytic facilities that are accessible from within graphs in Statistica (such as function fitting, smoothing, rotation, brushing, analytical zooming, etc.) are available and can be applied to the graph regardless of the source of the numbers in the graph or the method that was used to create it. The graph editing facilities offered in Statistica enable you to create not only highly customized scientific and technical publication-ready displays
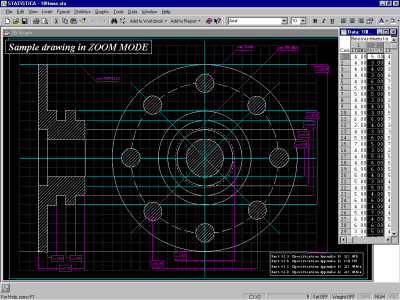
and precise drawings,
but also presentation-quality diagrams, posters, business charts, and other displays
that are designed to communicate information in an effective and attractive manner.
Graphs that are saved into files or that in any other way have been temporarily detached from the Statistica application (e.g., copied to the Clipboard or linked to a document in another application) are complete "objects" (technically speaking, ActiveX objects) that contain not only all customization features and other embedded objects, but also all data that are necessary to continue editing all aspects of the display or the analysis of its contents (fitting, smoothing, etc.).
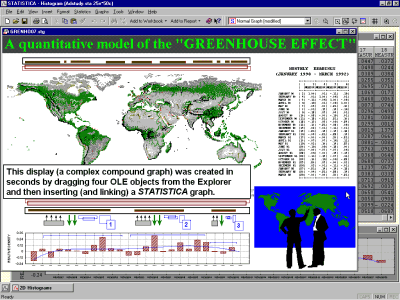
Because Statistica graphs are ActiveX objects, they can easily be linked to or embedded into other compatible documents (e.g., Excel or Word documents), where they can be in-place edited by double-clicking on them. Statistica Graphs are also ActiveX containers and, therefore, can contain a wide variety of embedded or linked documents such as Visio drawings, Adobe illustrations, Excel spreadsheets, or Word documents. Moreover, Statistica supports hierarchies of embedded objects up to four levels, which means that it can manage documents, containing documents, containing documents, that contain documents.
You can add ActiveX controls to graphs. When a graph is displayed, select OLE Control from the Insert menu to display the Insert Control dialog box, and select the desired control to be inserted.
Event Handlers for events generated by the ActiveX control can be defined in the Graph's Event Script by selecting View Code from the View - Events submenu.
- Customizing Graphs: Default Settings
In order to custom-tailor graphics options in Statistica and limit the need for repeating the same graph customization, the default settings of practically all features of Statistica graphs can be adjusted. This flexible system customizability is possible because all features of the appearance of Statistica graphs are driven by the same comprehensive system of internal "graphics styles." - Interactive Graph Customization
The customization options in Statistica graphs include hundreds of features, and they are used to customize every detail of the display and associated data processing so that even the default appearance and behavior of Statistica graphs will match your specific needs and/or will require very little intervention on your part.


