Example 2.2: Multiple Correspondence Analysis
This example illustrates how multiple correspondence analysis can be used to analyze the data presented in Example 2.1. As described in the Introductory Overview - MCA, multiple correspondence analysis is an extension of simple correspondence analysis to more than two categorical variables. In Example 2.1, a data set presented by Hoffman and Franke (1986) is discussed, which describes the preferences of 34 subjects for different beverages. The data file for that example (Beverage.sta) contains an indicator matrix, which is analyzed with simple correspondence analysis.
In this example, the data are coded in the more typical manner.
Specifying the analysis
- Open the Beverag2.sta data file (the entries in this data file indicate whether the respective subject has, over the past month, purchased and consumed the respective beverage).
- Start
Correspondence Analysis using one of the following ways:
- Ribbon bar. Select the Home tab. In the File group, click the Open arrow and on the menu, select Open Examples to display the Open a Statistica Data File dialog box. Beverag2.sta is located in the Datasets folder. Then, select the Statistics tab. In the Advanced/Multivariate group, click Mult/Exploratory and from the menu, select Correspondence to display the Correspondence Analysis (CA): Table Specifications Startup Panel.
- Classic menus. On the File menu, select Open Examples to display the Open a Statistica Data File dialog box. The data file is located in the Datasets folder.
- From the Statistics - Multivariate Exploratory Techniques submenu, select Correspondence Analysis to display the Correspondence Analysis (CA): Table Specifications Startup Panel.
- Select the Multiple Correspondence Analysis (MCA) tab. The name of the Startup Panel changes to Multiple Correspondence Analysis (MCA): Table Specifications. The data in the current format contains grouping variables only; therefore, you do not have to change the default selection in the Input group box - Raw data (requires tabulation).
- Click the Variables (Factors in Burt Table) button to display a standard variable selection dialog box. Select all variables, and then click the OK button.
- Click the OK button in the Startup Panel to perform the analysis. Statistica automatically finds the codes used in the data file, and produces the Burt table, which is the basis for the multiple correspondence analysis. The Multiple Correspondence Analysis Results dialog box is displayed.
Reviewing the results
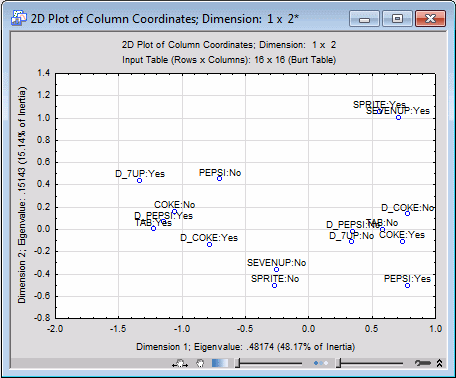
The results for the column coordinates (that is, the beverages) are identical to those discussed in Example 2.1. However, a few things should be noted: First, the overall Chi-square value that is reported in the Summary box is only valid if the input table were a standard two-way table, which it is not (see the Introductory Overview - MCA for a discussion of the special structure of a Burt table). Also, there are no row coordinates available; however, when we are analyzing very large samples, we are usually not interested in individual cases; moreover, if there are several thousand observations, the simple correspondence analysis of the indicator matrix is not convenient, and sometimes not possible. In those cases, the multiple correspondence analysis approach is much more efficient.
The interpretation of the coordinate values (that is, the axes) and auxiliary statistics for the column points is the same as that described in the context of simple correspondence analysis (see Example 2.1 and the Introductory Overview).
As described in the Introductory Overview, the orientation of axes in correspondence analysis is arbitrary (that is, each axis can be rotated by 180°). If you plot the results for the column points from the multiple correspondence analysis of the data in Beverag2.sta (In the Plots of coordinates group box, click the 2D button), and compare the graph with that produced in Example 2.1 (that is, using the simple correspondence analysis of the indicator matrix), you can see that the two axes in the plot are reversed.