Weibull and Reliability/Failure Time Analysis - Interpreting Results
Once a satisfactory fit of the Weibull distribution to the observed failure time data has been obtained, there are a number of different plots and tables that are of interest to understand the reliability of the item under investigation. Even if a good fit for the Weibull distribution cannot be established, distribution-free reliability estimates (and graphs) are also available on the Results dialog.
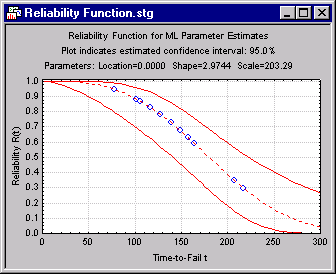
Reliability plots. This plot will show the estimated reliability function along with the confidence limits.
Hazard plots. As mentioned earlier, the hazard function describes the probability of failure during a very small time increment (assuming that no failures have occurred prior to that time). The plot of hazard as a function of time gives valuable information about the conditional failure probability.
- Kaplan-Meier plots
- The program will also compute and plot the so-called Kaplan-Meier or product-limit estimate of the reliability (survival) function. This estimate does not depend on any assumption about the nature of the underlying distribution; Statistica will compute both the standard estimates along with the confidence intervals.
Percentiles of the reliability function. Based on the fitted Weibull distribution, one can compute the percentiles of the reliability (survival) function. Statistica will compute the percentile values for this function, along with the confidence limits for these estimates (for maximum likelihood parameter estimates). These estimates are particularly valuable for determining the percentages of items that can be expected to have failed at particular points in time.


