Example 2: Rapid Deployment of Predictive Models
Using the Rapid Deployment of Predictive Models module, you can load one or more PMML (Predictive Models Markup Language) files containing deployment information, and compute very quickly (in a single pass through the data) predictions for large numbers of observations (for one or more models).
PMML is a XML-based (Extensible Markup Language) industry standard syntax. PMML files can be generated from practically all modules for predictive data mining including C&RT, CHAID, Boosted Trees, Random Forests, MARSplines, Support Vector Machines, Naïve Bayes, K-Nearest Neighbors, and Generalized EM & k-Means Cluster Analysis as well as statistical models including General Linear Models and Discriminate Analysis. PMML code is generated via the Code Generator button found in the Results dialog boxes.
This example describes how to take a fully trained model, create deployment code, and use Rapid Deployment to make predictions for new data.
Using an appropriate statistical or data mining tool, build and evaluate models relating the predictor variables to the target variable of interest. Once one or more appropriate models are found, generate the PMML script for those models. Save the script with the .xml extension.
For this example, we will use a fully trained set of data mining models. These are stored with the STATISTICA example data sets, and include:
- BostonHousingC&RT.xml,
- BostonHousingCHAID.xml,
- BostonHousingBoosted.xml,
- BostonHousingRandomForest.xml,
- BostonHousingMARSplines.xml,
- BostonHousingSANN.xml.
- BostonHousingSVM.xml
First, open the deployment data set. This can be a new data set that has the same variable names that were used when you created the model, or it can be the original data set with new cases appended to it.
This example uses the BostonHousing.sta data file. Open it by selecting Open Examples from the File menu (classic menus), or on the ribbon bar, select the Home tab; in the File group, click the Open arrow and select Open Examples from the menu; the data file is located in the Datasets folder.
We will add model prediction to the deployment data file. To do this, we must first add the appropriate variables. Insert a new variable into the data set, and name it Prediction: Right-click on the last variable name in the BostonHousing.sta data set, Value of Occupied Homes. From the shortcut menu, select Add Variables to display the Add Variables dialog box. Double-click in the After field. In the Select Variable dialog, select Value of Occupied Homes, and click OK. In the Name field, type Prediction. Click the OK button.
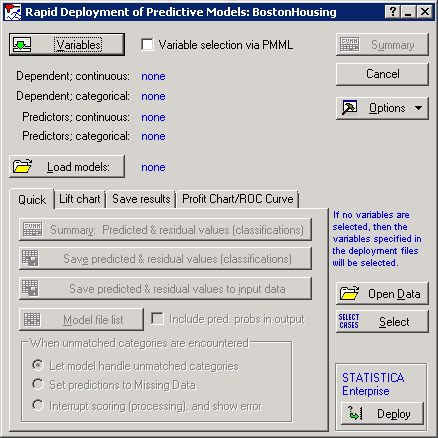
Select Rapid Deployment of Predictive Models (PMML) from the Data Mining menu (classic menus), or on the ribbon bar, select the Data Mining tab; in the Deployment group, click Rapid Deployment to display the Rapid Deployment of Predictive Models Startup Panel.
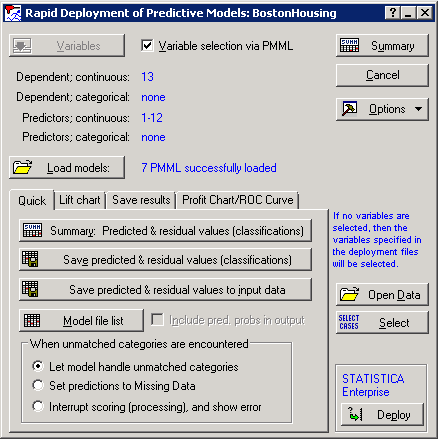
Click the Load models button. In the Open PMML files dialog box, browse to the location of the PMML files, and select them.
Click the Open button.
STATISTICA will recognize the dependent variable and predictor variables.
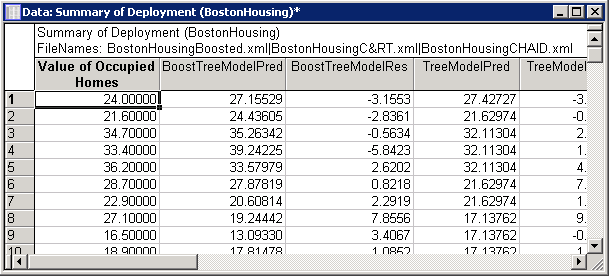
Click the Summary button. Two output spreadsheets are generated. The first one contains the prediction and residual values for each case and for each model loaded in Rapid Deployment. The average prediction is the last column of output, which uses all 7 data mining models as an ensemble to produce the average prediction. This is also called bagging.
The second output spreadsheet contains the error rates of the selected models in the deployment data file. Smaller values of error indicate better performing models. In this case, the Boosted Trees model gave the smallest error rate.
Now, we will add the average prediction output to the deployment data file. Click the Save predicted & residual values to input data button.
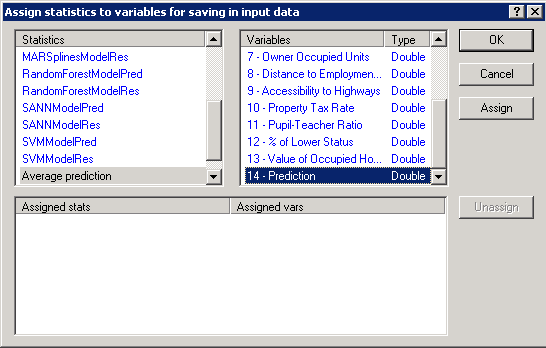
In the Assign statistics to variables for saving in input data dialog box, select Average prediction in the left pane, and select Prediction in the right pane.
Click the Assign button. This assigns the predictions from the Boosted Trees model to the predictions variable in the deployment spreadsheet.
Click the OK button, and the predicted values will be displayed in the Prediction column of the spreadsheet.


