Example 4 - Cox Proportional Hazards Model - Building and Deployment to New Data

The data set for this example, myeloma.sta, is taken from Krall, Uthoff, and Harley (1975). Multiple myeloma is a malignant disease characterized by the accumulation of abnormal plasma cells, a type of white blood cell, in the bone marrow.

Prerequisites

Open the example data file myeloma.sta, and start the Cox Proportional Hazards module. Following are instructions to do this from the ribbon bar and from the classic menus.

Procedure

  1. To display the Cox Proportional Hazards Regression dialog box
    • Ribbob bar:
      1. Select the Home tab.
      2. In the File group, click the Open arrow and from the menu, select Open Examples to display the Open a Statistica Data File dialog box. The data set is located in the Datasets folder.
      3. On the Statistics tab, in the Advanced/Multivariate group, click Advanced Models and from the menu, select Cox Proportional Hazards.
    • Classic Menu:
      1. Select Open Examples from the File menu to display the Open a STATISTICA Data File dialog box. myeloma.sta is located in the Datasets folder.
      2. From the Statistics - Advanced Linear/Nonlinear submenu, select Cox Proportional Hazards Models.
  2. Starting the analysis: In the Cox Proportional Hazards Regression dialog box, on the Quick tab, in the Input type group box, select the Survival time, covariates, factors, censor option button.
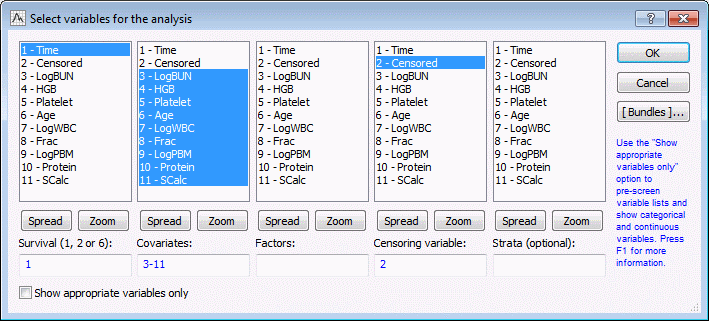
  3. Click the Variables button to display the variable specification dialog box, and specify variables as shown in the following image.
  4. Click OK.
  5. Specify the codes for the complete and censored values. Enter a value of 1 for the Code for complete responses and a value of 0 for the Code for censored responses.
  6. Select the Options tab.
  7. In the Model Building group box, select the Best Subsets option button.
  8. Click OK to run the analysis and display the Cox Proportional Hazards Results dialog box.
  9. On the Quick tab, click the Model Building button to produce the results of the best subsets procedure.

    This spreadsheet displays the best models for a given number of variables. Notice that as more variables are added to the model, the increase in the score statistic decreases.

  10. For this data, select the three variable model. To do this, in the Cox Proportional Hazards Results dialog box, click the Modify button to return to the Cox Proportional Hazards Regression dialog box.
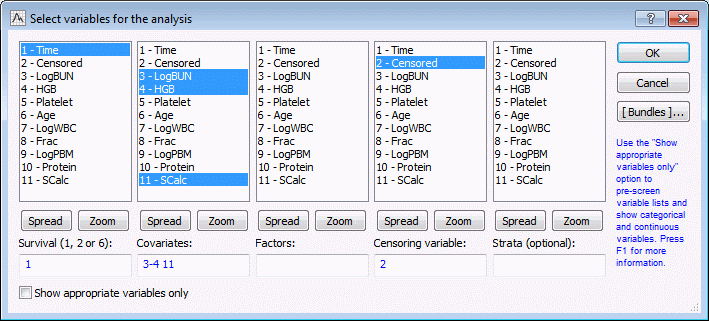
  11. On the Quick tab, click the Variables button, and specify variables as shown in the following image.
  12. Click OK.
  13. Select the Options tab.
  14. Select All Effects as the Model Building method.
  15. Click OK to run the analysis and display the Cox Proportional Hazards Results dialog box.
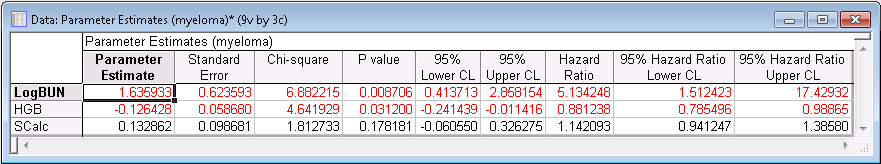
  16. On the Quick tab, click the Parameter estimates button to review the regression coefficients.
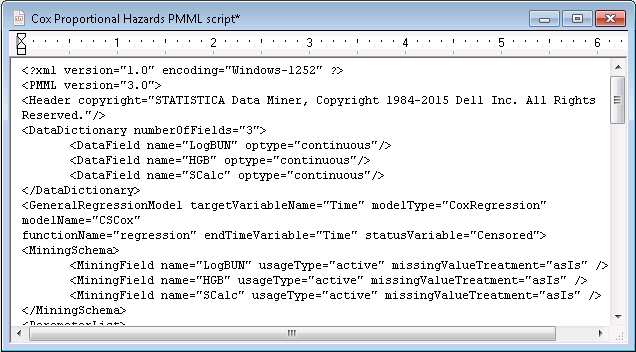
  17. To save this model and deploy it on new data, click the Code Generator button and select PMML script.

    You can save the PMML code and use the Rapid Deployment module to deploy the model.

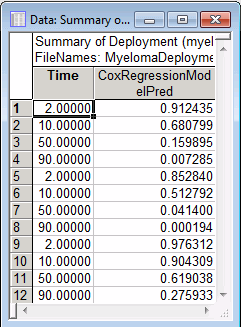
For the second part of this example, which involves deploying the Cox model, open the myeloma2.sta data file.

Start the Rapid Deployment module:

  • Ribbon bar: Select the Data Mining tab, and in the Deployment group, click Rapid Deployment.
  • Classic Menu: From the Data Mining menu, select Rapid Deployment of Predictive Models (PMML).

  1. In the Rapid Deployment of Predictive Models dialog box, click the Load models from disk button to display the Open PMML files dialog box.
  2. Open the MyelomaDeploymentScript.xml file located in the Datasets folder.
  3. Click the Summary: Predicted & residual values (classifications) button to produce the predicted survival probabilities as a function of the predictors and the observed time.