Cross-spectrum Analysis - Basic Notation and Principles
A simple example
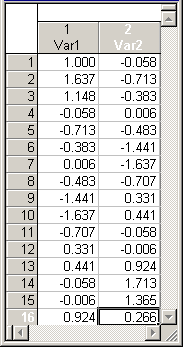
Consider the following two series with 16 cases:
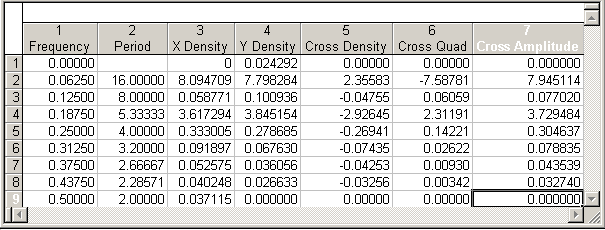
At first sight it is not easy to see the relationship between the two series. However, as shown below the series were created so that they would contain two strong correlated periodicities. Shown below are parts of the summary spreadsheet from the cross-spectrum analysis (the spectral estimates were smoothed with a Parzen window of width 3), w VAR1 as the Independent (X) variable and VAR2 as the Dependent (Y) variable.
Copyright © 2021. Cloud Software Group, Inc. All Rights Reserved.


