Conceptual Overviews - Ternary Plots
A ternary (or "trilinear") plot can be used to examine relations between three or more dimensions where three of those dimensions represent components of a mixture (i.e., the relations between them are constrained such that the values of the three variables add up to the same constant for each case). One typical application of this graph is when the measured response(s) from an experiment depends on the relative proportions of three components (e.g., three different chemicals) that are varied in order to determine an optimal combination of those components (e.g., in mixture designs; see Experimental Design).
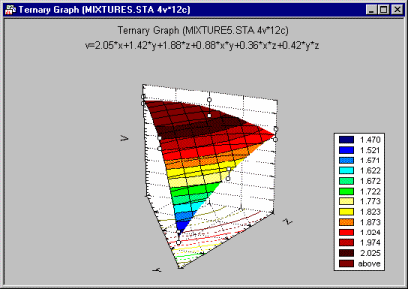
In ternary plots, the triangular coordinate systems are used to plot four (or more) variables (the components X, Y, and Z, and the responses V1, V2, etc.) in two dimensions (ternary scatterplots or contours) or three dimensions (ternary 3D scatterplots or surface plots). In order to produce ternary graphs, the relative proportions of each component (within each case) are constrained to add up to the same value (e.g., 1). By default, when the graph is produced, the proportions are rescaled so that they add to 1 in each case.
Applications
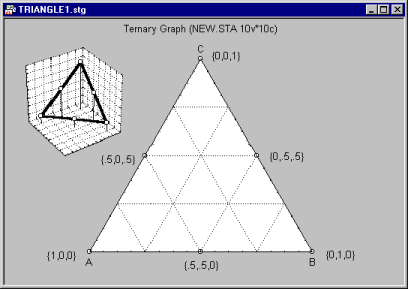
For example, take the following 6 different mixtures of the 3 components.
| A | B | C |
| 1 | 0 | 0 |
| 0 | 1 | 0 |
| 0 | 0 | 1 |
| .5 | .5 | 0 |
| .5 | 0 | .5 |
| 0 | .5 | .5 |
The sum for each mixture is 1.0, so the values for the components in each mixture can be interpreted as proportions. If you graph these data in a regular 3D scatterplot, it becomes apparent that the points form a triangle in the 3D space. Only the points inside the triangle where the sum of the component values is equal to 1 are valid mixtures. Therefore, you can simply plot only the triangle to summarize the component values (proportions) for each mixture.
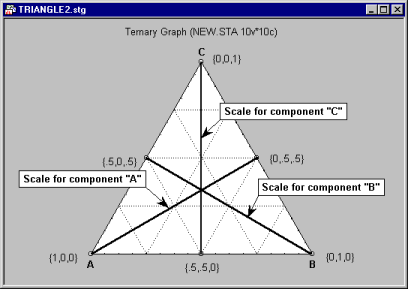
The three components are represented by axes that run from each apex to the midpoint of the opposite baseline; the location of individual data points are determined by their values (components) on the respective three axes.
To read off the coordinates of a point in the triangular graph, you would simply "drop" a line from each respective vertex to the side of the triangle below.
This can be further illustrated by the following example (recently discussed by Wainer, 1995).
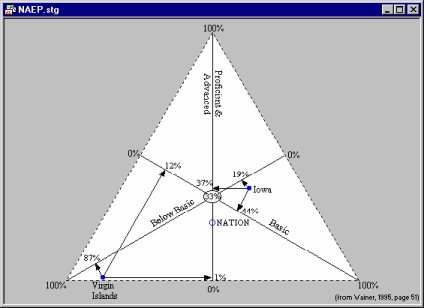
Student performance on tests of the National Assessment of Educational Progress (NAEP) was characterized into 3 levels of proficiency (Advanced/Proficient, Basic, and Below Basic). Results from different regions can be compared in a ternary plot where the percentage of students at each level of proficiency is plotted on the three axes.
The above graph from Wainer (1995, page 51) illustrates that 37% of Iowa students performed at the Advanced or Proficient level, 44% at the Basic level, and 19% Below Basic. By comparison, only 1% of Virgin Islands students performed at the Advanced or Proficient level, 12% were at the Basic level, and 87% were Below Basic.
Wainer also discusses another interesting application of triangular coordinate plots. The plot is used to examine the percentage vote in each of Britain's three political parties in the 1987 and 1992 general elections. Interested readers should refer to Wainer, 1995 for more information.
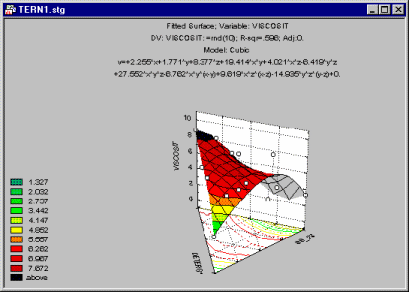
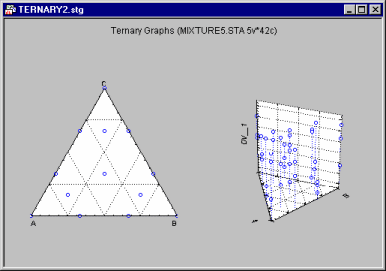
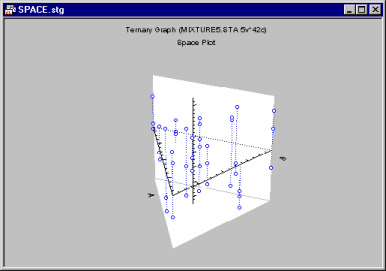
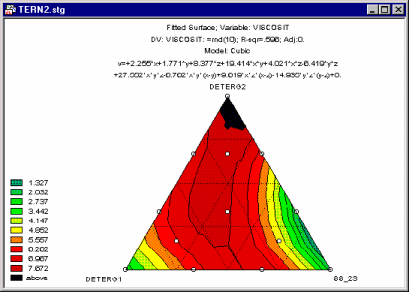
The following types of ternary graphs are offered in Statistica:
ternary surfaces (with projected contours),
ternary 2D and 3D scatterplots (regular and multiple),
ternary 3D trace plots, space plots, and deviation plots (regular and multiple),
ternary 2D contour plots (area or line pattern style).
Options are provided to handle cases with invalid sums as well as out of range cases. A selection of specialized ternary fitting options (Linear, Quadratic, Full Cubic, and Special Cubic models) are available for all surface and contour plots. The surface/contour levels can be generated according to user specifications, easily redefined, customized, and/or saved as defaults (or as reusable templates).
