Graphs of Input Data
The Graphs of Input Data command is available from the shortcut menu of all spreadsheets and it offers quick and simplified access to the most commonly used types of graphs that are based on the current input data set.
· Graphs of Input Data can be called directly from shortcut menus,
· Graphs of Input Data do not require the user to select variables (the variable selection is determined by the current cursor position within a spreadsheet), and
· Graphs of Input Data do not require the user to select options from any intermediate dialogs (default formats of the respective graphs are produced).
Graphs of Input Data process data directly from the current input datafile and they only take their cues as to which variables to use from the current cursor position (in any type of spreadsheet).
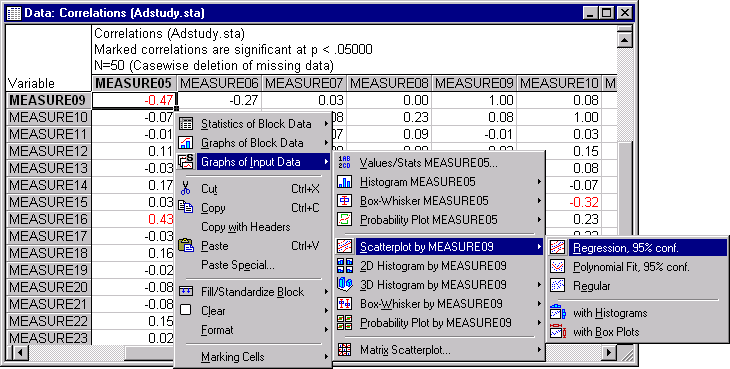
For example, if you right-click a single correlation in a results spreadsheet and create a Scatterplot by... graph, Statistica generates a 2D scatterplot using the original raw values of the two variables represented by that correlation (see the Introductory Example for a more detailed example).
Although the most convenient (and you could say most logical) way to select Graphs of Input Data is via the spreadsheet shortcut menu, you can also select them from the Graphs menu or the Statistica Start button
 menu. Either method will display a submenu from which you can choose one of the Statistical graphs applicable to the current variable (i.e., to the variable indicated by the current cursor position in the spreadsheet).
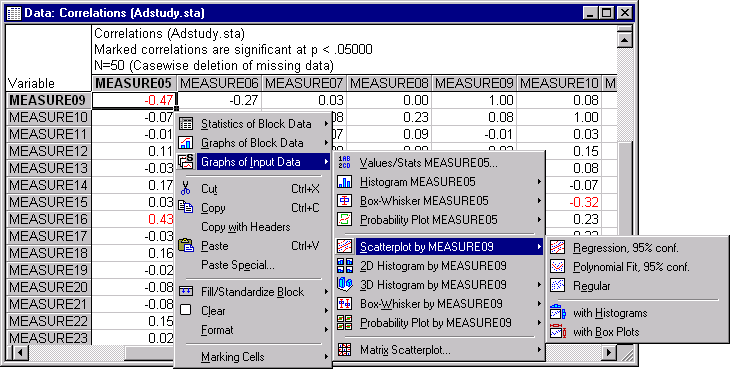
If the spreadsheet has a matrix format or a format where a cursor position indicates not one but two variables (as in the illustration showing a correlation matrix, below), then predefined bivariate graphs for the specified pair of variables will be directly available from the Graphs of Input Data menu.
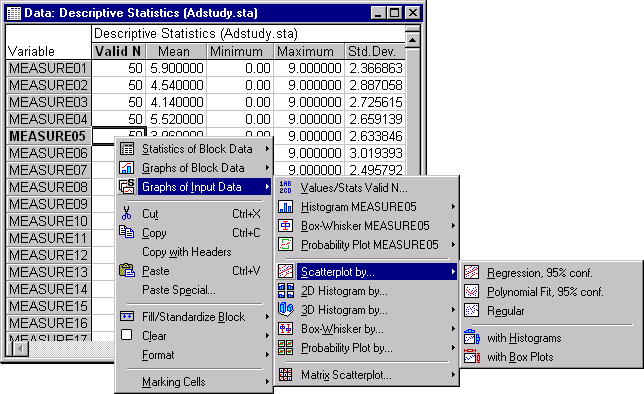
Otherwise (that is, when the current cursor position indicates only one variable as in a table of descriptive statistics, as shown in the illustration below), if you select any of the bivariate graphs in the menu, Statistica will prompt you to select the second variable. For example, in the illustration below, if you select Scatterplot by, Statistica would ask you by which variable Measure05 is going to be plotted.
If more than one variable is indicated by a highlighted section (i.e., when a block is selected), then the Graphs of Input Data menu will apply to the first selected variable.
When generating Graphs of Input Data, Statistica takes into account the current case selection and weighting conditions for the variables that are being plotted. Note, however, that the case selection or weighting conditions need to be specified for the current spreadsheet (i.e., using the Tools - Selection Conditions - Edit and the Tools - Weight menu commands) and not only "locally" for an analysis (i.e., selected from the respective analysis/graph specification dialogs using the
 and
and
 buttons). The latter conditions will be ignored by the Graphs of Input Data. For more information on specific types of Graphs of Input Data, click on the topic name below.
 Values/Stats of... Values/Stats of...
|
 2D Histogram by... 2D Histogram by... |
 Histogram of ... Histogram of ... |
 3D Histogram by... 3D Histogram by... |
 Box-Whisker of ... Box-Whisker of ... |
 Box-Whisker by... Box-Whisker by... |
 Probability Plot of ... Probability Plot of ... |
 Probability Plot by... Probability Plot by... |
 Scatterplot by... Scatterplot by... |
 Matrix Scatterplot Matrix Scatterplot
|
See also Graphs menu graphs, Graphs of Block Data, and Graphs gallery.


