Cause-and-Effect (Ishikawa) Diagrams - Arrows Tab
The Arrows tab of the Cause-and-Effect (Ishikawa) Diagrams dialog box contains options to modify characteristics of the arrows used in the cause-and-effect diagram. Note that a large number of graph customization options are available after the diagram has been created (see Graphs in Statistica and Graphics Styles).
Thickness of center arrow, in points
Enter the thickness of the center line arrow, in points in the
Thickness of center arrow, in points field. See also the Arrow Object Properties dialog box topic to learn about the various aspects of arrows and how to customize them.
Thickness of vertical arrows, in points
Enter the thickness of the horizontal (slanted) arrows for the categories of causes (see the
Cause-and-Effect Diagrams topic in the
Introductory Overview of
Process Analysis), in points. See also the Arrow Object Properties dialog box topic to learn about the various aspects of arrows, and how to customize them.
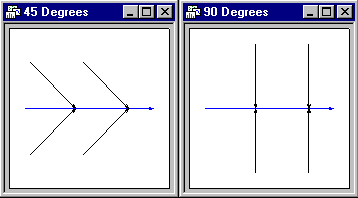
Angle of attachment of vertical arrows
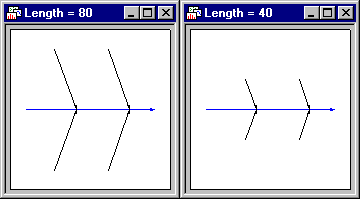
Length of arrows for causes in percent
Save settings as default
Click the
Save setting as default button to set the current settings (values) on this tab as well as the
Font sized
tab as the default; the next time you display this dialog, the current values will automatically be filled into the respective fields and used for the default cause-and-effect diagram.Reset
Click the
Reset button to reset all settings (values) on this tab and the
Font sized tab to the current default settings, i.e., either the original system settings (that were in effect when you first installed Statistica), or the values previously saved via the
Save settings as default button.
System defaults
Click the
System defaults button to reset all settings (values) on this tab and the
Font sized tab to the original system default settings (that were in effect when you first installed Statistica).

