Process Capability Analysis Normal and General Non-Normal Distribution (Raw Data) Tolerance Limits Tab
Select the Tolerance limits tab of the Process Capability Analysis Normal and General Non-Normal Distribution (Raw Data) dialog to access the options described here.
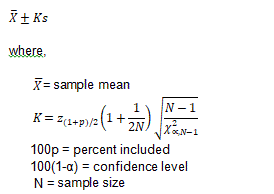
The concept of tolerance limits is explained in the Introductory Overview. In short, we can estimate with a particular degree of certainty the limits within which a certain percent of the population of units will fall.
Normal distribution tolerance limits
Click the Normal distribution tolerance limits button to display a spreadsheet with which to estimate the tolerance limits for different parameters. Normal tolerance limits are based on the assumption that the characteristic (variable) of interest is normally distributed. We can compute the actual tolerance limits given the respective N (sample size), confidence level, and percent of units in the population to be included in the tolerance limits. Refer to Montgomery (1985, p. 300) for details concerning the computations.
Tolerance limit computation for normal distribution:
Compute limits based on
The Compute limits based on group box contains three options: Number of cases, Percent included, and Confidence level. Use these options to select the parameters to compute normal tolerance limits.
Number of cases
Use the Number of cases box to enter values with which to examine the consequences of more or fewer cases in the sample; changing this value will change the interval limits.
Percent included
Use the Percent included box to change the percent of the population that is to be included in the respective tolerance limits. Changing this parameter will adjust the tolerance limits.
Confidence level
Use the Confidence level box to change the confidence level for the prediction. Changing this parameter will change the tolerance limits.
Distribution free tolerance limits
Click the Distribution free tolerance limits button to display a spreadsheet with which to estimate the tolerance limits for different parameters.
Distribution-free tolerance limits do not require any assumption about the shape of the underlying distribution, as long as the variable is random and continuous (the distribution-free limits are based on the distribution of extreme values).
The limits are fixed to the extreme values found in the sample and, given those extremes and the respective samples size, we can (1) compute, with a given Confidence level, the expected percent of the population of units that falls within these extremes, or (2) compute, given the Percent included, the respective Confidence level. Refer to Montgomery (1985, p. 300) for details concerning the computations.
Distribution-free limits
The Distribution-free limits group box contains two options: Base on percent of cases included and Base on confidence level. Use these options to select the parameters to compute distribution free tolerance limits.
Base on percent of cases included
Select the Base on percent of cases included option button to change the percent of the population that is to be included in the respective tolerance limits. The tolerance limits are fixed to the extreme (minimum and maximum) values in the sample, and the Confidence limits will be adjusted.
Base on confidence level
Select the Base on confidence level option button to change the Confidence level for the prediction. The tolerance limits are fixed to the extreme (minimum and maximum) values in the sample, and the Percent included in this limit will be adjusted.
