Creating a Document Style
Statistica's document styles are collections of various aspects of the graph pertaining to overall size, margins, etc., of the graph document. See Document Style Overview for details.
Here is an example of how to create a document style and then use it to quickly customize a graph. First, to create the document style, select Options from the Tools menu. On the Documents/Graphs: Settings tab of the Options dialog box, review the current Document size and Graph margins. For this example, create a Document style specifying a particular graph document size (e.g., that makes the graph suitable for immediate inclusion into some report).
Set the Width field in the Document size group box on the Documents/Graphs: Settings tab to 3 and the Height field to 2. Then set the margins to 0.5 in each Graph margins field.
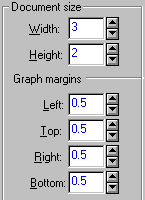
To save these proportions as a document style click the
 button to the right of the Graph document style box, and select Save As, then type in the name of the new style in the Save As dialog box.
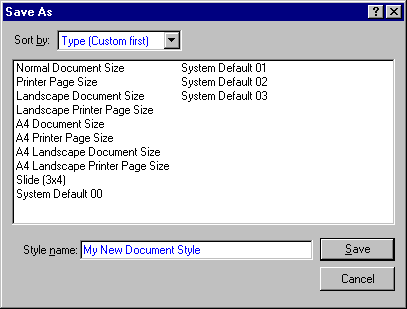
Click the Save button, and the respective Document style (new document size and margins) will be saved. Next, click OK in the Options dialog box; from now on, all graphs will be created using these new sizes and margins, unless you select the Normal Document Size (or other) style again on the Documents/Graphs: Settings tab of the Options dialog box.
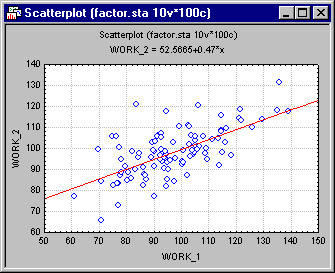
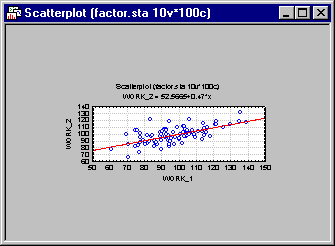
You want to quickly redraw this graph using the new specifications for sizes and margins as previously defined in the new document style. To apply this style, double-click on the background of the graph to display the Graph Options dialog box. On the Graph: Window tab, select My New Document Style in the Style box.
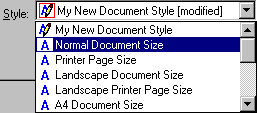
Then click the OK button in the Graph Options dialog box to redraw the graph, and the new sizes and margins will be applied.
