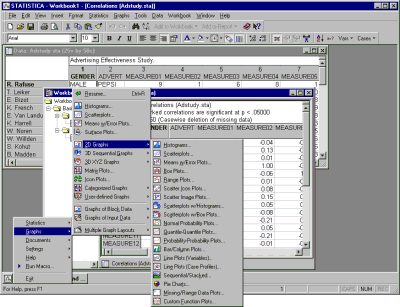
Graphs Menu Graphs
Commands available on the Graphs menu provide a complete selection of all Statistical graphs and all optional customizations available in Statistica. They are available from not only the Graphs menu, but also the Statistica Start button  menu and offer hundreds of types of graphical representations and analytic summaries of data.

Graphs menu graphs include 2D Graphs, 3D Sequential Graphs, 3D XYZ Graphs, Matrix Plots, Icon Plots, Categorized Graphs, and User-Defined Graphs. Note that the top portion of that menu includes four or five of the most commonly used types of graphs (Histograms, Scatterplots, Mean/Error Plots, etc.), and the lower portion contains the comprehensive list of all graph types. Like all menus in Statistica, it can be easily customized (use the Menu tab of the Customize dialog, accessed from the Tools - Customize menu) to position the most commonly used options in the most convenient locations.