Recode Outliers and Extreme/Rare Values
You can access the Recode Outliers and Extreme/Rare values dialog box in the following ways:
- Ribbon bar. Select the Data tab. In the Transformations group, click Filter/Recode and on the menu, select Recode Outliers to display the Recode Outliers and Extreme/Rare values dialog box.
- Classic menus. On the Data - Data Filtering/Recoding submenu, select Recode Outliers to display the Recode Outliers and Extreme/Rare values dialog box.
Use these options to detect and recode outliers in the input spreadsheet.
| Option | Description |
|---|---|
| Input | Use the options in the Input group box to specify the variables and cases to process. |
| Variables | Click the Variables button to display a standard variable selection dialog box, which is used to select the variables to filter for outliers. The selected variables will be evaluated, and outliers in those variables will be recoded. |
| Cases | Click the Cases button to display the Spreadsheet Case Selection Conditions dialog box, which contains options to select only specified observations or cases for the data filtering operation. |
| K Iterations | Enter the number of iterations (passes through the data) to make when detecting outliers. When applied iteratively, Statistica in consecutive iterations removes outliers from computations, and recomputes/re-identifies outliers based on the standard deviations and means computed for the respective iteration. If 1 is entered, no iterations are made. |
| Repeat until all outliers have been recoded | Select this check box to iterate recoding until no further outliers are found. |
| Use caseweights | Select this check box to use the currently assigned spreadsheet case weights before recoding outliers. When this check box is selected, values of the case weight variable specified in the Spreadsheet Case Weights dialog will be used as case multipliers before the outliers are detected and recoded. If the check box is cleared, the assigned case weight will be disregarded for this analysis. Note that when case weights have not been assigned, this check box will be dimmed. |
| Recoding parameters | Use the options in this grid to specify the Measurement type, outlier Test, test Parameters, recode Type, Values to use, and Marking method for each of the selected variables. |
| Variables | This column shows the variables that have been selected for outlier analysis. To modify the variable selection, click the Variables button in the Input group box (see above). |
| Measurement | This column reports the measurement type for the selected variable. By default, Statistica uses the measurement type indicated in the variable specification dialog. To change the measurement type, double-click in the cell and select either Continuous or Categorical from the drop-down list. Outlier detection options are different depending on the measurement type. Note that you can use the standard SHIFT+click and CTRL+click conventions to select more than one variable to set the same measurement for multiple variables at one time. |
| Test | Double-click in a Test cell to display a list of available outlier detection tests. Note that you can use the standard SHIFT+click and CTRL+click conventions to select more than one variable to set the same test for multiple variables at one time. The following tests are available:
|
| Parameters | In this column, enter the parameter for the selected test. For the Categorical test, this value represents the relative frequency. It should be between 0 and 1. For Normal outlier tests, the value should be between 1 and 10. For Grubbs outlier tests, the parameter must be between 0 and 1, and for the Percentile tests, it can be any number between 1 and 100. For Tukey outlier tests, the value must be between 1 and 5. For more information on a specific test, see Tests, above. |
| Type | Double-click the Type cell to select the type of recoding to use for identified outliers. Note that you can use the standard SHIFT+click and CTRL+click conventions to select more than one variable to set the same type for multiple variables at one time. Available recoding methods are as follows. |
| No Recode | Select this option to identify outliers without recoding them. |
| Recode to MD | Select this option to recode the outlier to the missing data value specified in the variable specification dialog (-999999998 by default). |
| Recode to Value | Select this option to replace outlier values with a user-defined value (as specified in the Values column). |
| Recode to Mean | Select this option to replace outlier values with the variable mean. |
| Recode to Mode | Select this option to replace categorical outlier values with the mode (the observation that occurs most frequently). |
| Recode to Percentile | Select this option to replace outlier values with a specific percentile value; note that the percentile value should be specified in the Values column. When performing a two-sided test, you can specify two percentiles in the Values column, separated by a space. The first value will be used for the low side value (i.e., outliers on the low side will be replaced with the lower percentile) and the second value will be used for the high side value (i.e., outliers on the high side will be replaced with the higher percentile). |
| Recode to Boundary | When a Grubbs test is specified, outlier values will be replaced with the most extreme upper or lower value in the range of valid values that were not identified as outliers. For all other tests, the outlier is replaced with the actual boundary value. |
| Values | If you have selected Recode to Value in the Type column, enter the value you want to assign to all outliers. If you have selected Recode to Percentile, enter the percentile (e.g., 25 or 75) to use. |
| Marking | In addition to recoding outlier values, you can mark outlier values using case states. Click in the cell, and then click the arrow to display a list of marking options. You can choose from No change, Label, Off, Marked, or Cell Marked. Note that if the outlier values have been recoded to missing data (Recode to MD, see option description above), the outlier values cannot be marked. For more information on case states, see the Case State dialog box topic. |
| Output | Use the options in this group box to specify whether a new spreadsheet will be created and which variables (from the original data set) should be included in it. Note that when new spreadsheets are created, they will contain all variable properties of the parent spreadsheet, e.g., variable header formats, display formats, measurement types, etc. For more information on variable properties, see the variable specification dialog box. |
| Variables | Click the Variables button to display a standard variable selection dialog box, which is used to select variables in the input spreadsheet that will be included in the output (filtered) spreadsheet. |
| Create new spreadsheet | When this check box is selected, Statistica creates a new spreadsheet that contains only the filtered data. If this check box is cleared, then detected outliers will be recoded and/or marked in the input spreadsheet. |
| Copy formatting | Select the Copy formatting check box to use the spreadsheet formats (e.g., cell formatting, variable header formatting, or even Spreadsheet Layouts) of the input spreadsheet in the output spreadsheet. When this check box is cleared, formatting in the input spreadsheet will not be copied to the new spreadsheet. |
| OK | Click OK to accept the options specified here and recode outliers in the current spreadsheet. |
| Cancel | Click Cancel to close this dialog box without recoding outliers in the current spreadsheet. |
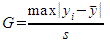
 is an outlier if G is greater than the critical value,
 is the sample mean
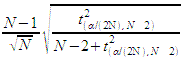
 is the critical value from a t distribution with N-2 degrees of freedom and a significance level of
 .
.