Graphics Styles - Applying a Graphics Style
Suppose you have created a graphics style by specifying various non-default point markers for scatterplots, and you have used Save As to save the style under the name MyScatterplotStyle. There are various ways to retrieve the style and apply it to selected newly created scatterplots:
Select the style on the Appearance tab.
Ribbon bar. Select the Graphs tab. In the Common group, click Scatterplots to display the 2D Scatterplots dialog box.
Classic menus. from the Graphs menu, select Scatterplots to display the 2D Scatterplots dialog box.
Specify the variables for the plot, etc., and then select the Appearance tab. Select the newly created style from the Use graph style drop-down list.
Select the style from the Graphics Style box.
When a graph is displayed:
Ribbon bar. Select the Edit tab. The Graphics Style box is located in the Customize Graph group.
Classic menus. The Graphics Style box is located on the Graph Tools toolbar.


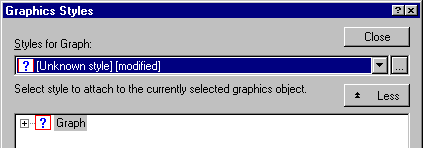
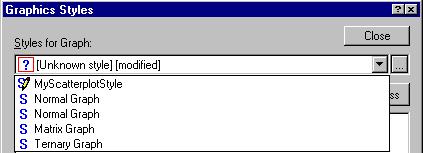
Now, click the Styles for Graph drop-down box to see all currently available styles.

Select MyScatterplotStyle to apply all specifications in that style to the current (existing) graph.
See also, Importing and Exporting Styles.