How do I plot a parametric curve?
To plot a parametric curve, select Custom Function Plots from the Graphs - 2D Graphs menu. Select the Custom Function tab of the 2D Custom Function Plots dialog box, and select Parametric curve in the Type box.
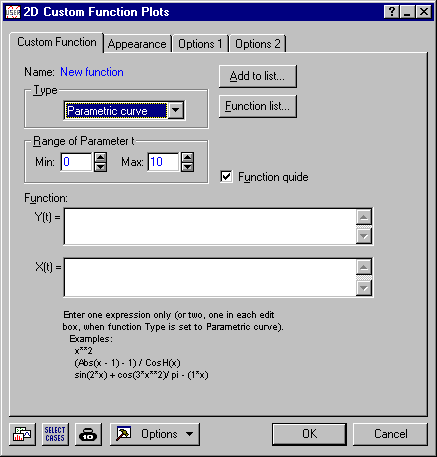
This option enables you to plot a curve in the x-y plane that is defined parametrically; i.e., a curve that is defined by two simultaneous functions of a parameter t that ranges over some interval (Minimum, Maximum). You can specify an equation y = f(t) for the y-component of the curve, and an equation x = g(t) for the x-component of the curve; the range of parameter t can be specified in the Range of Parameter t group (Minimum, Maximum). This option allows you to plot various curves and functions that cannot be expressed in a simple fit of Type Function.
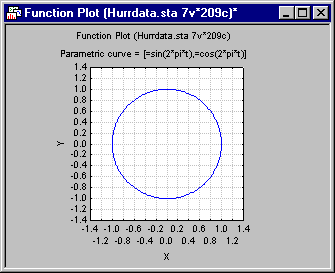
y(t)=sin(2*pi*t)
x(t)=cos(2*pi*t)
For 0<=t<=1 (i.e., set the Minimum and Maximum values to 0 and 1, respectively).
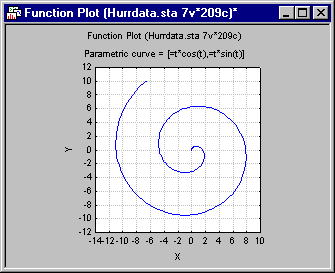
y(t)= t*cos(t)
x(t)= t*sin(t)
For 0<=t<=12 (i.e., set the Minimum and Maximum values to 0 and 12, respectively).