Plot: Fitting (3D XYZ Graphs)
These options are available in the Fitting dialog box, accessible by right-clicking on a point in the graph and selecting Fitting from the shortcut menu. You can also access these options via the Graph Options dialog box - Fitting tab (located under Plot).
Use these options to add a new surface to the 3D XYZ graph with the desired appearance or to modify the fitted surface by selecting the desired surface specifications. Several specifications are available to customize the axes as well as the display of the values on the modified graph.
 Linear Linear
|  Neg Expon Weighted LS Neg Expon Weighted LS
|
 Quadratic Quadratic
|  Spline Spline
|
 Distance Weighted LS Distance Weighted LS
|  Wafer Wafer
|
Min:, Max:. The Min and Max fields are available when you have selected Custom Range in the Range drop-down box. If this is the case, then the fit will be calculated using the range of values specified in the Min and Max fields.

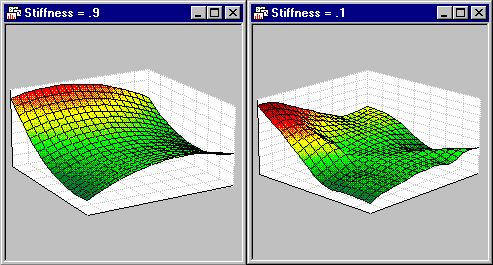
The lower the coefficient, the more the shape of the curve is influenced by individual data points (i.e., the curve "bends" more to accommodate individual values and subsets of values). Large values of the parameter produce smoother curves that adequately represent the overall pattern in the data set at the expense of local details. The stiffness parameter is used when the Distance Weighted LS, Neg Expon Weighted LS, or Spline fit is fitted to the data (see Fit type, above). See McLain, 1974.
