Generalized EM and k-Means Cluster Analysis Overview
The methods implemented in the Generalized EM and k-Means Cluster Analysis module of Statistica are similar to the k-Means algorithm included in the standard Cluster Analysis options, and you may want to review in particular the k-Means Clustering Introductory Overview for a general overview of these techniques and their applications. The purpose of these techniques is generally to detect clusters in observations (or variables), and to assign those observations to the clusters.
A typical example application for this type of analysis is a marketing research study where a number of consumer-behavior related variables are measured for a large sample of respondents; the purpose of the study is to detect "market segments," i.e., groups of respondents that are somehow more similar to each other (to all other members of the same cluster) when compared to respondents that "belong to" other clusters. In addition to identifying such clusters, it is usually equally of interest to determine how those clusters are different, i.e., the specific variables or dimensions on which the members in different clusters will vary, and how.
k-Means clustering. The classic k-Means algorithm was popularized and refined by Hartigan (1975; see also Hartigan and Wong, 1978). Statistica specifically uses Lloyd's method to implement the k-Means algorithm. The basic operation of that algorithm is relatively simple: Given a fixed number of (desired or hypothesized) k clusters, assign observations to those clusters so that the means across clusters (for all variables) are as different from each other as possible. (See also, Differences in k-Means Algorithms in Generalized EM & k-Means Cluster Analysis vs. Cluster Analysis for additional details regarding the specific computational algorithms used in these two Statistica modules.)
- Instead of assigning cases or observations to clusters so as to maximize the differences in means for continuous variables, the EM (expectation maximization) clustering algorithm rather computes probabilities of cluster memberships based on one or more probability distributions. The goal of the clustering algorithm is to maximize the overall probability or likelihood of the data, given the (final) clusters.
- Unlike the classic implementation of k-Means clustering in the Cluster Analysis module, the k-Means and EM algorithms in the Generalized EM and k-Means Cluster Analysis module then can be applied to both continuous and categorical variables.
- A major shortcoming of k-Means clustering has been that you need to specify the number of clusters before starting the analysis (i.e., the number of clusters must be known a priori); the Generalized EM and k-Means Cluster Analysis module uses a modified v-fold cross-validation scheme (similar to that implemented in the Classification Trees, Classification and Regression Trees, and General CHAID modules) to determine the best number of clusters from the data. This extension makes the Generalized EM and k-Means Cluster Analysis module an extremely useful data mining tool for unsupervised learning and pattern recognition.
A comprehensive overview of different clustering techniques in the context of data mining is provided in Witten and Frank (2000). The following paragraphs will also describe in greater detail the methods implemented in this module.
Unsupervised learning vs. supervised learning
An important distinction in machine learning, and also applicable to data mining, is that between supervised and unsupervised learning algorithms. The term "supervised" learning is usually applied to cases where a particular classification is already observed and recorded in a training sample, and you want to build a model to predict those classifications (in a new testing sample). For example, you may have a data set that contains information about who from among a list of customers targeted for a special promotion did or did not responded to that offer; the purpose of the classification analysis would be to build a model to predict who (from a different list of new potential customers) is likely to respond to the same (or a similar) offer in the future. You may want to review the methods discussed in the sections on General Classification and Regression Trees (GC&RT), General CHAID Models (GCHAID), Discriminant Function Analysis, and General Discriminant Analysis (GDA), and Statistica Automated Neural Networks to learn about different techniques that can be used to build or fit models to data where the outcome variable of interest (e.g., customer did or did not respond to an offer) was observed. These methods are called supervised learning algorithms, because the learning (fitting of models) is "guided" or "supervised" by the observed classifications recorded in the data file.
In unsupervised learning the situation is different. Here the outcome variable of interest is not (and perhaps cannot) be directly observed. Instead we want to detect some "structure" or clusters in the data that may not be trivially observable. For example, you may have a database of customers with various demographic indicators and variables potentially relevant to future purchasing behavior. Your goal would be to find market segments, i.e., groups of observations that are relatively similar to each other on certain variables; once identified, you could then determine how best to reach one or more clusters by providing certain goods or services you think may have some special utility or appeal to individuals in that segment (cluster). This type of task calls for an unsupervised learning algorithm, because learning (fitting of models) in this case cannot be guided by previously known classifications; only after identifying certain clusters might you begin to assign labels, for example, based on subsequent research (e.g., after identifying one group of customers as "young risk takers"). Other methods (other than k-Means or EM clustering) that would fall into the category of unsupervised learning algorithms are Factor Analysis, Principal Components and Classification Analysis, Multidimensional Scaling, Correspondence Analysis, Neural Networks Self-Organizing Feature Maps (SOFM), etc.
The k-Means algorithm
The classic k-Means algorithm is discussed in some detail in the Cluster Analysis Overviews; a thorough introduction and review can also be found in Hartigan and Wong (1978). To reiterate, the basic algorithm for k-Means clustering is rather straightforward: Given a user-defined fixed number of clusters k, move around the observations (cases) between the clusters to maximize the distances between the cluster centers; the cluster centers are usually defined by a vector of means for all (continuous) variables in the analysis.
The EM algorithm
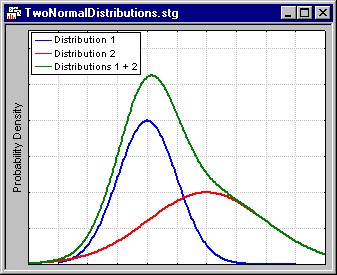
The EM algorithm for clustering is described in detail in Witten and Frank (2001). The basic approach and logic of this clustering method is as follows: Suppose you measured a single continuous variable in a large sample of observations. Further, suppose that the sample consisted of two clusters of observations with different means (and perhaps different standard deviations); within each sample, the distribution of values for the continuous variable follows the normal distribution. The resulting distribution of values (in the population) may look like this:
The implementation of the EM algorithm in the Generalized EM and k-Means Cluster Analysis module allows you to select (for continuous variables) the normal, log-normal, and Poisson distributions. You can select different distributions for different variables, and thus derive clusters for mixtures of different types of distributions.
Finding the right number of clusters: v-fold cross-validation
The clustering techniques available in the Generalized EM and k-Means Cluster Analysis module were specifically optimized and enhanced for typical applications in data mining. The general metaphor of data mining implies the situation where the analyst searches for useful structures and "nuggets" in the data, usually without any strong a priori expectations of what s/he might find (in contrast to the hypothesis-testing approach of scientific research). In practice, the analyst usually does not know ahead of time how many clusters there might be in the sample. For that reason, the program includes an implementation of a v-fold cross-validation algorithm for automatically determining the number of clusters in the data.
This unique algorithm is immensely useful in all general "pattern-recognition" tasks. To determine the number of market segments in a marketing research study, the number of distinct spending patterns in studies of consumer behavior, the number of clusters of different medical symptoms, the number of different types (clusters) of documents in text mining, the number of weather patterns in meteorological research, the number of defect patterns on silicon wafers, and so on.
The v-fold cross-validation algorithm applied to clustering. The v-fold cross-validation algorithm is described in some detail in the context of the Classification Trees, General Classification and Regression Trees (GC&RT), and General CHAID modules. The general idea of this method is to divide the overall sample into a number of v folds, or randomly drawn (disjoint) sub-samples. The same type of analysis is then successively applied to the observations belonging to the v-1 folds (training sample), and the results of the analyses are applied to sample v (the sample or fold that was not used to estimate the parameters, build the tree, determine the clusters, etc.; i.e., this is the testing sample) to compute some index of predictive validity. The results for the v replications are aggregated (averaged) to yield a single measure of the stability of the respective model, i.e., the validity of the model for predicting new observations.
As mentioned earlier, cluster analysis is an unsupervised learning technique, and we cannot observe the (real) number of clusters in the data. However, it is reasonable to replace the usual notion (applicable to supervised learning) of "accuracy" with that of "distance": In general, we can apply the v-fold cross-validation method to a range of numbers of clusters, and observe the resulting average distance of the observations (in the cross-validation or testing samples) from their cluster centers (for k-Means clustering); for EM clustering, an appropriate equivalent measure would be the average negative (log-) likelihood computed for the observations in the testing samples.
Reviewing the results of v-fold cross-validation. The results of v-fold cross-validation are best reviewed in a simple line graph.
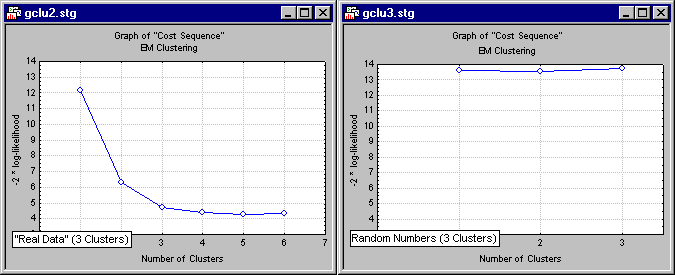
Shown here is the result of analyzing a data set widely known to contain three clusters of observations (specifically, the well-known Iris data file reported by Fisher, 1936, and widely referenced in the literature on discriminant function analysis; see also the Discriminant Function Analysis Examples). Also shown (in the above-right graph) are the results for analyzing simple normal random numbers. The "real" data (shown to the left) exhibit the characteristic scree-plot pattern (see also Factor Analysis), where the cost function (in this case, 2 times the log-likelihood of the cross-validation data, given the estimated parameters) quickly decreases as the number of clusters increases, but then (past 3 clusters) levels off, and even increases as the data are overfitted. The random numbers on the other hand show no such pattern, in fact, there is basically no decrease in the cost function at all, and it quickly begins to increase as the number of clusters increases, and overfitting occurs.
It is easy to see from this simple illustration how useful the v-fold cross-validation technique applied to k-Means and EM clustering can be for determining the "right" number of clusters in the data.
Some caveats: local minima, bad start values
While in most cases the program will quickly and efficiently derive useful and valid cluster solutions, there are conditions that may cause the iterative algorithms to fail.
Program overview
The Generalized EM and k-Means Cluster Analysis module is an implementation and extension of k-Means and EM (expectation maximization) clustering techniques. Both continuous and categorical variables can be specified for the analyses. For k-Means clustering, different distance measures can be specified: Euclidean, Squared Euclidean, City-Block (Manhattan), and Chebychev (for details, see also Joining (Tree Clustering) Introductory Overview - Distance Measures). For EM clustering, you can choose from among three different distributions for continuous variables: normal, log-normal, and Poisson.
The program implements a modified v-fold cross-validation scheme (similar to that implemented in the Classification Trees, General Classification and Regression Trees (GC&RT), and General CHAID modules) to determine the best number of clusters from the data. This extension makes the Generalized EM and k-Means Cluster Analysis module an extremely useful data mining tool for unsupervised learning and pattern recognition. Various code-generator options (for C/C++/C#, Visual Basic, and PMML) are included for deploying cluster solutions in a data mining environment. (See also, Using C/C++/C# Code for Deployment.)
Detailed results statistics are reported to enable users to evaluate the appropriateness of the final cluster solution, to review the final assignments of observations to clusters, and to save the cluster assignments and other statistics as input for further analyses.
The implementations of the clustering methods in the Generalized EM and k-Means Cluster Analysis module are highly scalable, and these methods can be applied to even very large data sets.