Example 2: Binomial Linear Model with Logit Link (Logistic Regression)
This example is based on the example data file Crabs.sta (Agresti, 1996, p. 82-83). The data describes the number of horseshoe crab satellites by the female's color, spine condition, width, and weight. Specifically, the data file contains the following variables:
Y: Derived indicator variable; 0 if Satellts (number of satellites) is equal to zero, 1 if Satellts is greater than zero
COLOR: Color of the crab (categorical predictor with 4 categories)
SPINE: Spine condition for the crab (categorical predictor with 3 categories)
WIDTH: Carapace width of the female crab in centimeters
SATELLTS: Number of satellites; that is the number of male crabs attached to the female's nest, in addition to the single male crab that was attached to each nest
WEIGHT: Weight of the crab in kilograms
CATWIDTH: Width of Carapace, the hard outer case.
Open the Crabs.sta data file:
Ribbon bar. Select the Home tab. In the File group, click the Open arrow and select Open Examples to display the Open a Statistica Data File dialog. The data file is located in the Datasets folder.
Classic menus. From the File menu, select Open Examples to display the Open a Statistica Data File dialog. The data file is located in the Datasets folder.
Ribbon bar. Select the Statistics tab. In the Advanced/Multivariate group, click Advanced Models and from the drop-down list, select Generalized Linear/Nonlinear to display the Generalized Linear/Nonlinear Models Startup Panel.
Classic menus. From the Statistics - Advanced Linear/Nonlinear Models submenu, select Generalized Linear/Nonlinear Models to display the Generalized Linear/Nonlinear Models Startup Panel.
- Select the Advanced tab, and select General custom designs as the Type of analysis, Quick specs dialog as the Specification method, Binomial as the Distribution, and Logit as the Link functions. Then click the OK button to display the GLZ General custom design Quick Specs dialog.
- Click the Variables button to display the standard variable selection dialog. Select Y as the Dependent (response) variable, Color and Spine as the Categ. (factors), and Width and Weight as the Continuous predictors (covariates), and then click the OK button.
- We will use the default model, thus, we will be fitting a factorial design for the categorical predictors Color and Spine, and the main-effects only model for the continuous predictors Width and Weight.
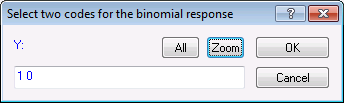
- Click the Response codes button to display the code selection dialog. Enter 1 0 in the edit field (1 space 0) and click
OK.
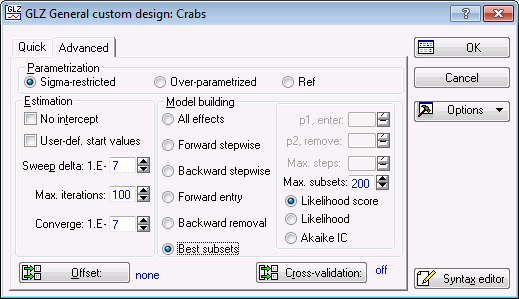
- You can use best subset model building to determine a set of effects that producez a satisfactory fit to the data (prediction of indicator variable Y).
- In the GLZ General custom design dialog, select the
Advanced tab. In the
Model building group box, select the
Best subsets option button. The
Advanced tab is displayed.
- Now click the OK button to display the GLZ -- Results dialog.
- If you want to run this example using GLZ Syntax, you can run the following syntax program from the GLZ Analysis Syntax Editor dialog (see Methods for specifying designs).
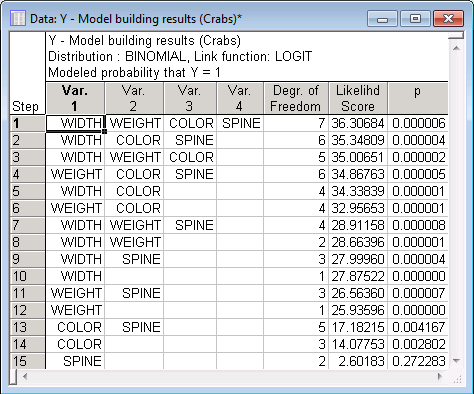
In this output, each case represents a possible model. The first 4 variables (columns) denote the effects found in each model. The first model, with the highest likelihood score, includes all 4 possible main effects.
You can see that the best single predictor model is the one with the main effect for Width only; the best model with two effects is the one with Width and Color.
Let's further evaluate the simplest model, that is, the one with variable Width only.
In the GLZ -- Results dialog, click the Modify button to return to the GLZ General custom design Quick Specs dialog. On the Quick tab, click the Variables button and select variable Width as the only Continuous predictor [clear the selected Categ. (factors) Color and Spine, and the other Continuous predictor Weight]; then, click the OK button.
Also, on the Advanced tab under Model building, select the All effects option button, which clears the Best subsets option button. Then, click the OK button to display the GLZ -- Results dialog.
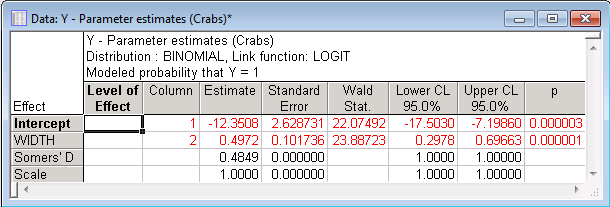
The sign of the parameter estimates implies that a female crab that is relatively wide (variable Width contains measurements of the carapace width in centimeters) has a higher probability of having more than one satellite (variable Y is an indicator variable of whether the respective crab had more than one extra satellite; all crabs had at least one male satellite).
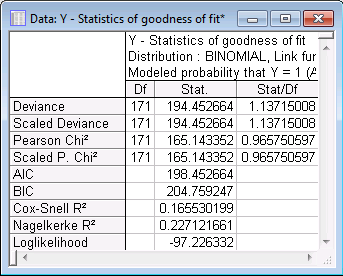
The ratios of the various statistics (Deviance, Scaled Deviance, Pearson Chi2, Scaled Pearson Chi2) to the respective degrees of freedom are close to 1.0 in all cases. Thus, there is no evidence of over-dispersion. This suggests that the value of the parameter estimate for variable Width is appropriately scaled.
In this case, the Pearson or deviance Chi-square statistics may not have the necessary properties to be valid goodness of fit statistics (McCullagh and Nelder, 1989, p. 120). To address this problem, in the GLZ -- Results dialog on the Summary tab, select the Aggregation check box to generate (internally) a new data set in which each row of the design matrix is unique, so that each row implies a sub-population of data. Then click the Aggreg. data button to display a spreadsheet with the aggregated data.
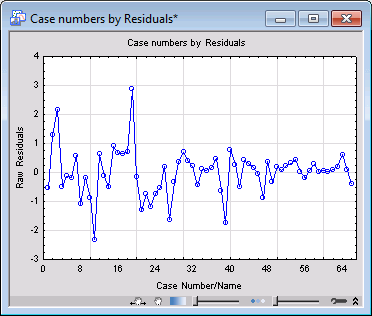
After selecting the Aggregation check box, when you click the Goodness of fit button again, you can see that the reported values are different. Also, all observational statistics including raw residuals, predicted values, and observed values are computed based on the aggregated data when you select the Aggregation check box. There are only 66 unique observations in the aggregated data. For example, display the plot of residuals verses case numbers (on the Resid. 1 tab, click the Res. & case no. button ). You can see that there are only 66 observations in this plot.