GC&RT Introductory Overview - Basic Ideas Part II
Advantages of Classification and Regression Trees (C&RT) Methods
As mentioned earlier, there are a large number of methods that an analyst can choose from (and they are all available in the Statistica system) when analyzing classification or regression problems. Tree classification techniques, when they "work" and produce accurate predictions or predicted classifications based on few logical if-then conditions, have a number of advantages over many of those alternative techniques.
General Computation Issues and Unique Solutions of Statistica GC&RT
The computational details involved in determining the best split conditions to construct a simple yet useful and informative tree are quite complex. Refer to Breiman et al. (1984) for a discussion of their CART ® algorithm to learn more about the general theory of and specific computational solutions for constructing classification and regression trees; Statistica's GC&RT module implements those techniques and extends them in several ways (see also the discussion of ANCOVA-like predictor designs). An excellent general discussion of tree classification and regression methods, and comparisons with other approaches to pattern recognition and neural networks, is provided in Ripley (1996). Computational Details also provides in some detail how the C&RT algorithm works. What follows is a brief discussion of some computational solutions and unique features of Statistica C&RT.
Avoiding Over-Fitting: Pruning, cross-validation, and V-fold cross-validation
A major issue that arises when applying regression or classification trees to "real" data with much random error noise concerns the decision when to stop splitting. For example, if you had a data set with 10 cases, and performed 9 splits (determined 9 if-then conditions), you could perfectly predict every single case. In general, if you only split a sufficient number of times, eventually you will be able to "predict" ("reproduce" would be the more appropriate term here) your original data (from which you determined the splits). Of course, it is far from clear whether such complex results (with many splits) will replicate in a sample of new observations; most likely they will not.
This general issue is also discussed in the literature on tree classification and regression methods, as well as neural networks, under the topic of "overlearning" or "overfitting." If not stopped, the tree algorithm will ultimately "extract" all information from the data, including information that is not and cannot be predicted in the population with the current set of predictors, i.e., random or noise variation. The general approach to addressing this issue is first to stop generating new split nodes when subsequent splits only result in very little overall improvement of the prediction. For example, if you can predict 90% of all cases correctly from 10 splits, and 90.1% of all cases from 11 splits, then it obviously makes little sense to add that 11th split to the tree. Statistica offers many such criteria for automatically stopping the splitting (tree-building) process, and they are further described in Computational Details.
Once the tree building algorithm has stopped, it is always useful to further evaluate the quality of the prediction of the current tree in samples of observations that did not participate in the original computations. These methods are used to "prune back" the tree, i.e., to eventually (and ideally) select a simpler tree than the one obtained when the tree building algorithm stopped, but one that is equally as accurate for predicting or classifying "new" observations.
Reviewing Large Trees: Unique Analysis Management Tools
Another general issue that arises when applying tree classification or regression methods is that the final trees can become very large. In practice, when the input data are complex and, for example, contain many different categories for classification problems and many possible predictors for performing the classification, then the resulting trees can become very large. This is not so much a computational problem as it is a problem of presenting the trees in a manner that is easily accessible to the data analyst, or for presentation to the "consumers" of the research.
Statistica offers three ways in which complex trees can be reviewed. Like all graphs in Statistica, the tree chart summarizing the final solution (tree) can be "navigated" using the standard zooming tools. So for example, you can quickly zoom into an area of a larger tree that is of particular interest, and use the zoom pan button to move around the graph (see also Navigating (zooming on) the summary tree graph, below).

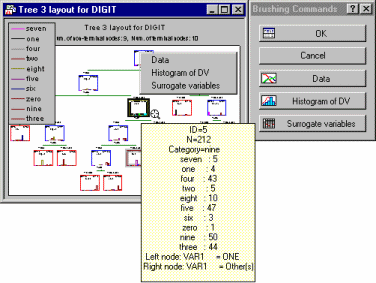
Click on a node to select (highlight) it, and then choose any of the options from the floating ("brushing") toolbar or the shortcut menu for that node.
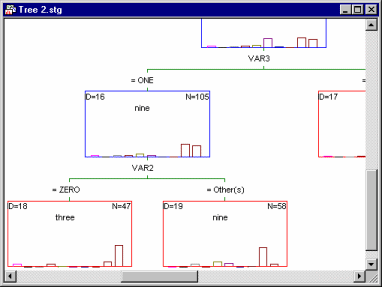
In a sense, this method allows you to move a (resizable) window over a much larger tree graph.
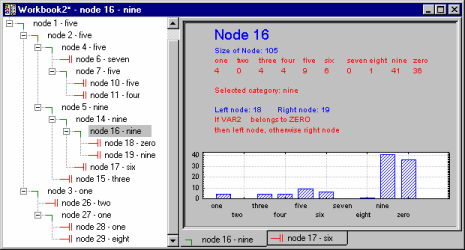
For example, the illustration above was taken from an analysis of the Digit.sta example data set (see also Classification Trees Analysis Example 1: Discriminant-Based Univariate Splits for Categorical Predictors; or Example 1: Pattern Recognition). The goal of the analysis was to accurately predict a single digit number (between 0 and 9) from 7 "noisy" predictors (for a description of how these data were generated, see Breiman et. al., 1984). The final tree results are displayed in the workbook tree browser, which clearly identifies the splitting nodes ( ) and terminal nodes (
 ) of the tree. To review the statistics and other information (e.g., splitting rule) associated with each node, simply highlight it and review the summary graph in the right pane. In the example above, split Node 16 identifies a split on Var2: If it is equal to 0, then the respective observations are classified to Node 18 (i.e., they are identified as digit Zero); if Var2 is not equal to 0, then the respective observations are classified as Nine.
The split nodes can be collapsed or expanded, in the manner that most users are accustomed to from standard MS Windows-style tree-browser controls. This is the most efficient method for reviewing complex tree models, and at this time Statistica is the only program that incorporates this necessary device to review and present results.
Another useful feature of the workbook tree browser is the ability to quickly review the effect of consecutive splits on the resulting child nodes in an "animation-like" manner. For example, shown below is the summary result from a regression-like analysis. Place the mouse pointer in the left pane and select (highlight) the root node, and then use the arrow keys on your keyboard to move down as the splits are added to the tree.
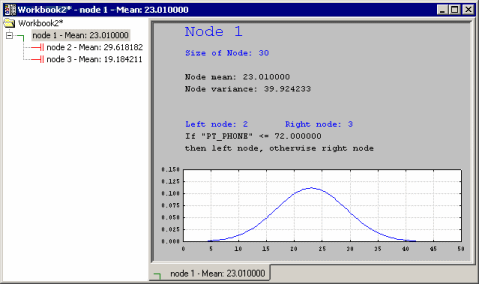
The splitting of the overall sample into sub-groups (nodes) of increasing purity (homogeneity, or smaller variance) is evident in this illustration.
Navigating (zooming on) the summary tree graph. Of course, you can also navigate the traditional summary tree graph, using the standard Statistica zooming tools.
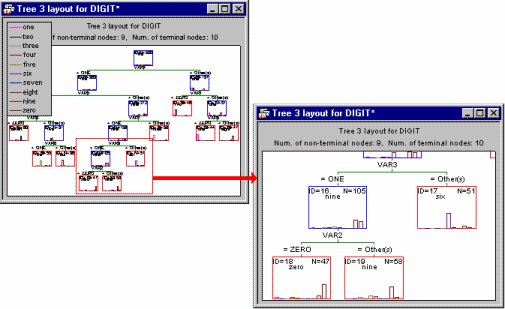
These tools can be used to review all details of large and complex tree graphs.
Analyzing ANCOVA-like Designs
The classic (Breiman et. al., 1984) classification and regression trees algorithms can accommodate both continuous and categorical predictor variables (see also, Computational Details). However, in practice, it is not uncommon to combine such variables into analysis of variance/covariance (ANCOVA) like predictor designs with main effects or interaction effects for categorical and continuous predictors. This method of analyzing coded ANCOVA-like designs is relatively new and, to date, only available in Statistica GC&RT as well as GCHAID. However, it is easy to see how the use of coded predictor designs expands these powerful classification and regression techniques to the analysis of data from experimental designs (e.g., see for example the detailed discussion of experimental design methods for quality improvement in the context of the Experimental Design module of Industrial Statistics).