MQC Charts Example 4 - Creating a Multiple Stream Chart
The example is based on the data file MultipleStreams.sta. The data contains measurements from a machine that fills 10 eight-ounce bottles of juice at a time. Each spigot on the machine is considered a data source or data stream, thus the Multiple Stream Process (MSP) has 10 streams. When the process is in-control, the amount of juice in a bottle will be eight ounces, regardless of which spigot filled the bottle.
Specifying the analysis.
Ribbon bar. Open the data file by selecting the Home tab. In the File group, click the Open arrow and select Open Examples to display the Open a Statistica Data File dialog. The data file is located in the Datasets folder.
Then, select the Statistics tab. In the Industrial Statistics group, click Multivariate to display the Multivariate Quality Control Charts Startup Panel.
Then, from the Statistics - Industrial Statistics & Six Sigma submenu, select Multivariate Quality Control to display the Multivariate Quality Control Charts Startup Panel.
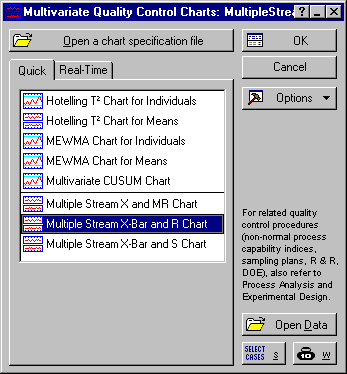
Select Multiple Stream X-Bar and R Chart on the Quick tab. Click the OK button to display the Defining Variables for Multiple Stream X-Bar and R chart dialog. On the Quick tab, click the Variables button. In the variable selection dialog, in the Measurements list, select variables 1-10.
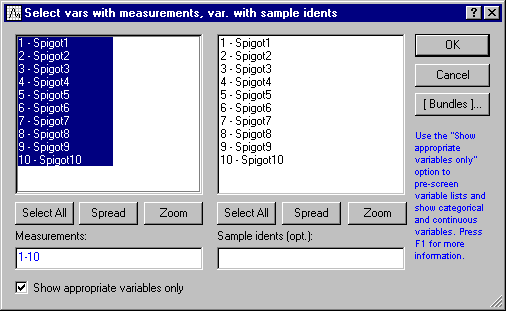
Click OK to close the variable selection dialog. On the Defining Variables for Multiple Stream X-Bar and R chart dialog - Quick tab, enter a value of 5 in the field for the Constant Sample Size. Click OK to create the chart.
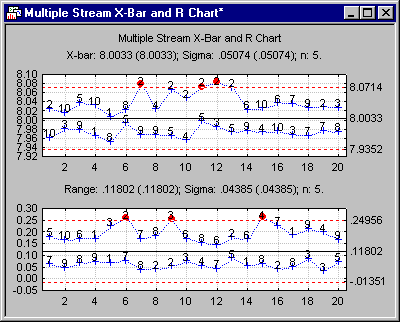
The Group X-bar chart, illustrated above, shows 20 samples from the 10 stream process. Note that in the plot above, the maximum X-bar from samples 7, 11, 12, and 13 are all outside the control limits and are all from stream 2. Also note that stream 2 is the largest value in the stream for five consecutive samples (9-13). If the process is in control, we will expect to see the same stream producing an extreme value five times in a row only once about every 10,000 samples. This appears to be evidence that stream 2 is different than the other streams and, thus, may indicate a quality problem that needs to be resolved.