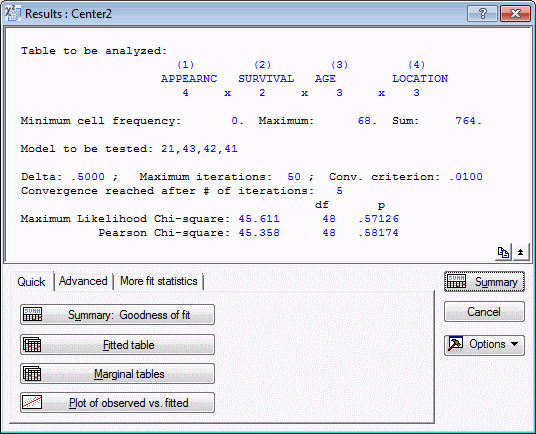
Log-Linear Results Dialog
Click the OK button in the Log-Linear Model Specification dialog to display the Log-Linear Analysis Results dialog, which contains three tabs:
- Quick
- Advanced
- More fit statistics
Note: The observed and marginal frequency tables that can be displayed from this dialog will include the Delta constant, as specified on the
Log-Linear Model Specification dialog -
Advanced tab. Therefore, when using Log-Linear as a crosstabulation program, make sure that Delta is set to 0 (zero); otherwise you will not obtain accurate frequency counts.
A particularly useful Graph of Input Data for all tables is the 3D histogram. This graph is very helpful in order to visualize the pattern of frequencies, residuals, etc. in the table.
| Element Name | Description |
|---|---|
| Summary Box | The
Summary box at the top of the dialog displays information about the current log-linear analysis.
|
| Summary | Click the Summary button to create a spreadsheet containing the Maximum Likelihood Chi-square value and the Pearson Chi-square value, along with their corresponding degrees of freedom and p-values. |
| Cancel | Click the Cancel button to return to the Log-Linear Model Specification dialog. |
| Options | Click the
Options button to display the
Options menu.
Note: Plot options. After selecting any of the plot options, a scatterplot of the respective values will be displayed:
|
These graphs are very useful for evaluating the overall fit of the model for different magnitudes of frequencies, and for detecting outliers.
Subtopics