Analyzing Data Quality
Data quality analysis is a process of verifying data values against known rules to ascertain if the values accurately represent the real-world entity. Rules are an implementation of an underlying service and rules are generally associated with a data class. There are several built-in rules available for data quality analysis. These rules can be mapped to a single data attribute or a group of data attributes.
During data analysis, one or more of the following steps are executed:
- Data values may be cleansed by removing unexpected characters, leading, or trailing spaces.
- Data values may be validated against data specifications using regular expression checks, blacklist/whitelist checks, lookups, LUHN validation, etc.
- Missing or incomplete data values may be enriched using reference data or other statistical data imputation methods.
- Data values may be standardized by reformatting the output values.
- Data values may be normalized by detecting and replacing abnormal values.
- Tag values may be generated to report data defects or to highlight other data facts.
- The overall outcome of the
analysis is summarized into a tag category as:
- VALID. Input value is either valid or has defects that were fixed (cleansed) and output value is considered valid.
- INVALID. Input value is invalid and could not be fixed.
- CLEANSED. Input value has deficiencies that were fixed and output value is considered valid.
- MISSING. Input value is missing (blank spaces or null).
Mapping Rules
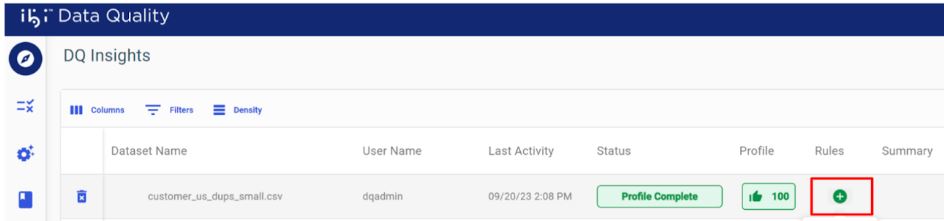
To add (assign) rules when analyzing data:
- Click
Add under Rules, as shown in the following image.
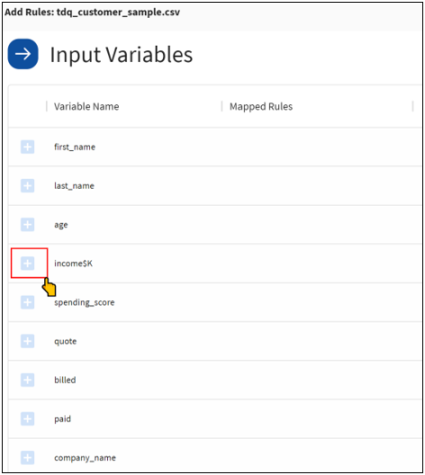
- In the left pane of the
mapping window, click the plus (+) icon next to an input data variable (for
example, income$K), as shown in the following image.
The Select Rule dialog opens, as shown in the following image.
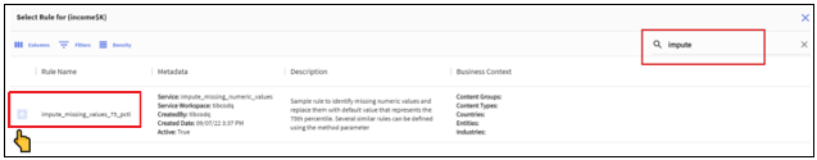
- Search the Rules Catalog and select the most appropriate rule.
- Map input data variables to the rule input.
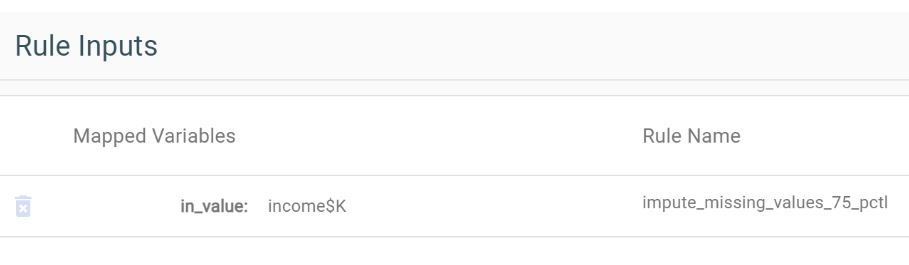
Single Variable Rules
These rules need one input and once selected, the input data variable is automatically mapped to the rule input (for example, income$K).
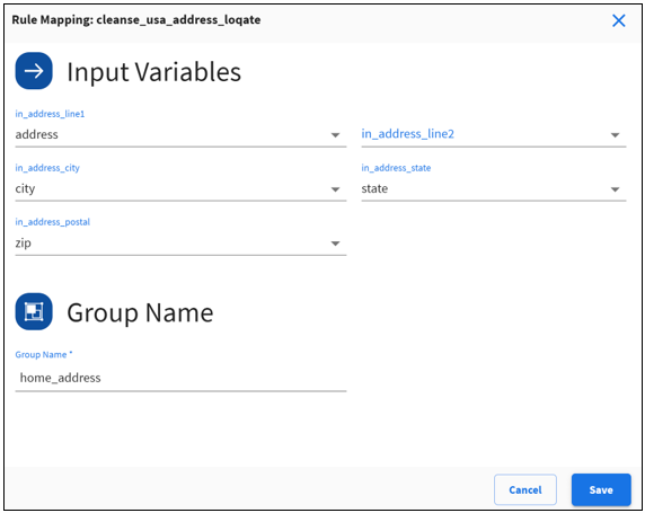
Multi-Variable Rules
These rules require multiple inputs.
- Map each rule input to an input variable.
- Provide a meaningful group name.
Note: The group name is used to generate the output results file name, so make sure you provide a unique group name.
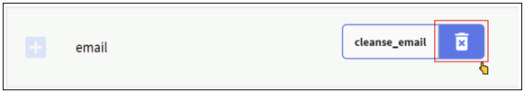
Preassigned Rules
Some columns may have a preassigned rule based on the data class discovered by the profiler. You can delete and reassign a different rule if the assigned rule is not appropriate for the input variable.
Verify all the rules associated with the input variables before submitting the data for processing.
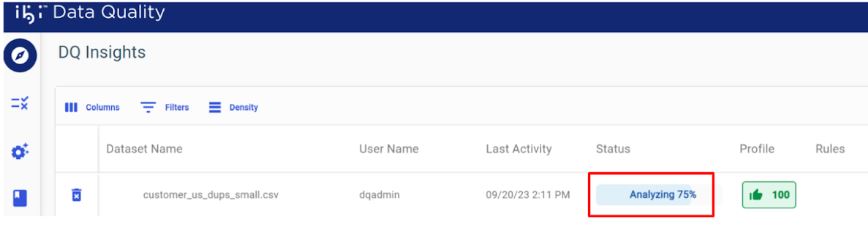
Tracking Analysis Progress
The analysis progress bar displays the current processing status, as shown in the following image.
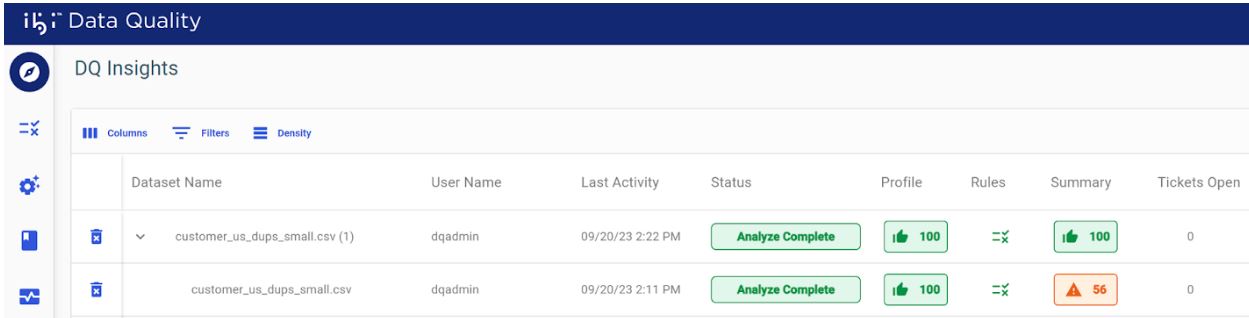
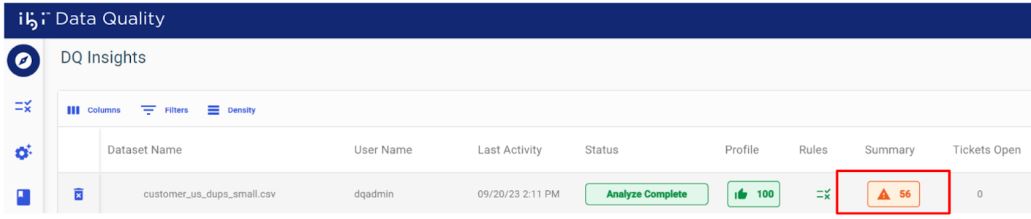
Viewing a Summary of Analysis Results
You can view a summary of analysis results by clicking View under Summary, as shown in the following image.
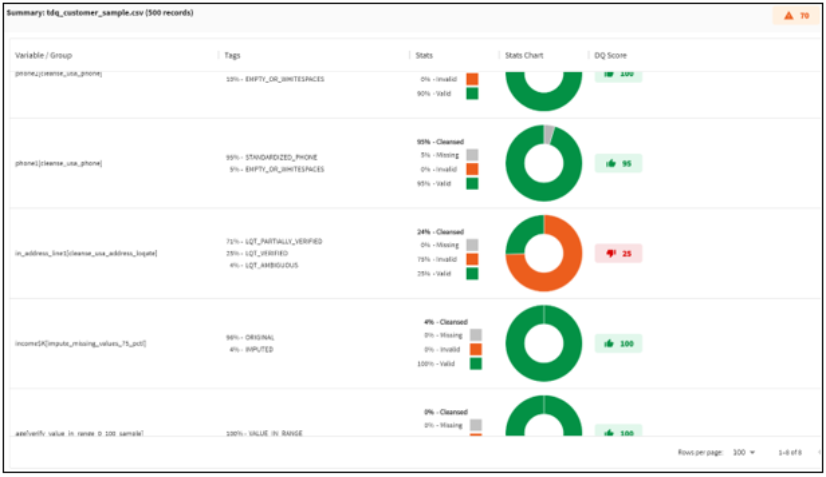
Summarized results contain:
|
Result |
Description |
|---|---|
|
Overall DQ Score |
Data Quality (DQ) score for the entire data set. This score will be in the range 0 to 100 (100 is the best). |
|
Rule based DQ Score |
Data Quality (DQ) score for each rule applied to a variable or a group of variables. This score will be in the range 0 to 100 (100 is the best). |
|
Tags |
List of issues or reportable facts identified during the data quality analysis. |
|
Stats & Stats Chart |
Summarized stats for final outcome of the analysis.
|
The following is a sample summary of analysis report.
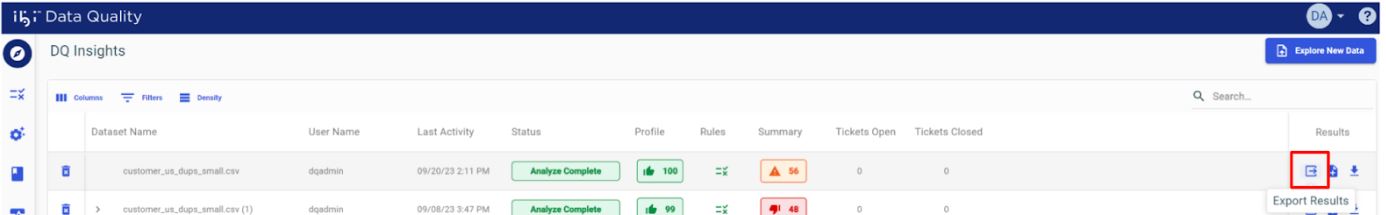
Exporting the Results
You can download the detailed results in two different ways:
- Merge and Export create a single output CSV data set by combining input columns with output columns .
- Download All Download the results as a single zip file
Merge and Export
Note: This feature will only work with Rules that are built on DQ Services that generate a single output record for each input record. If a DQ Service generates more than one output record for each input record, then Merge will fail.
For more information, refer to batchSize in DQ Service Definition.
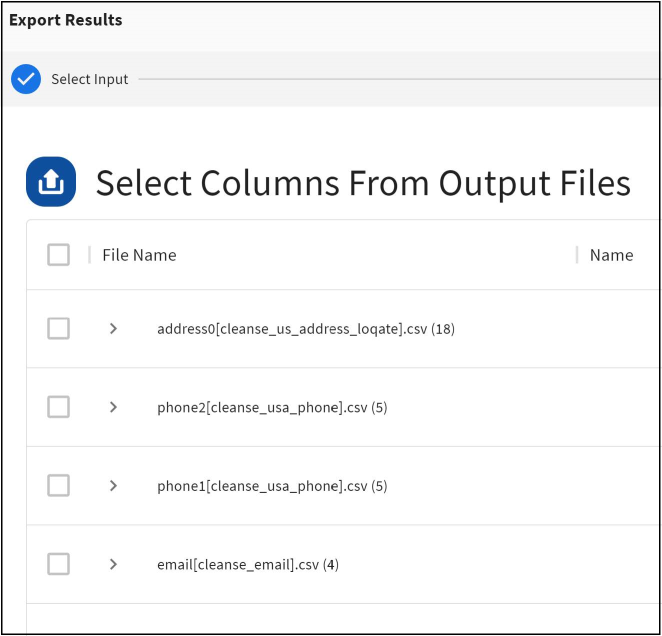
You can export the results into a single csv file by clicking on Export button under Results.
- Select the columns, you want
to include from the input data set.

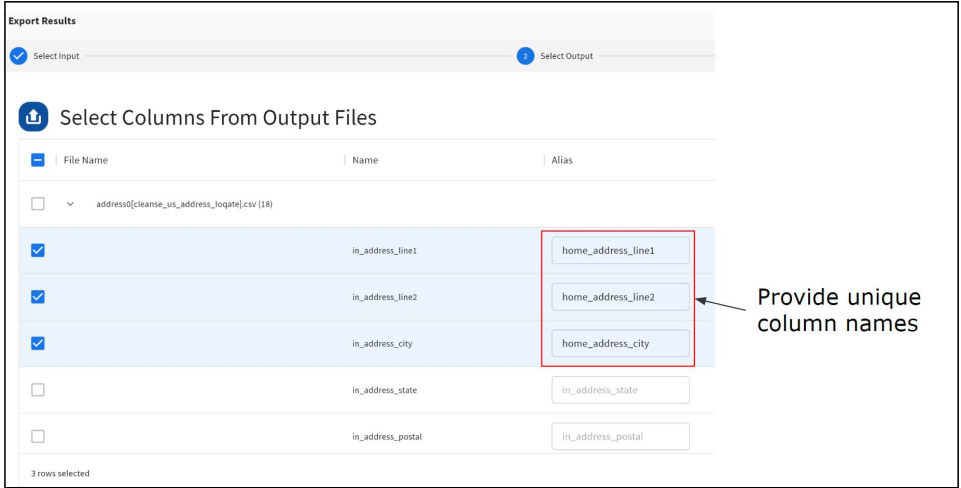
- Select the columns you want
to include from the different output data sets.
Note:You have the option to rename the output columns by entering unique column names in the Alias field. By default, the system will automatically generate unique column names if different output files have the same columns.
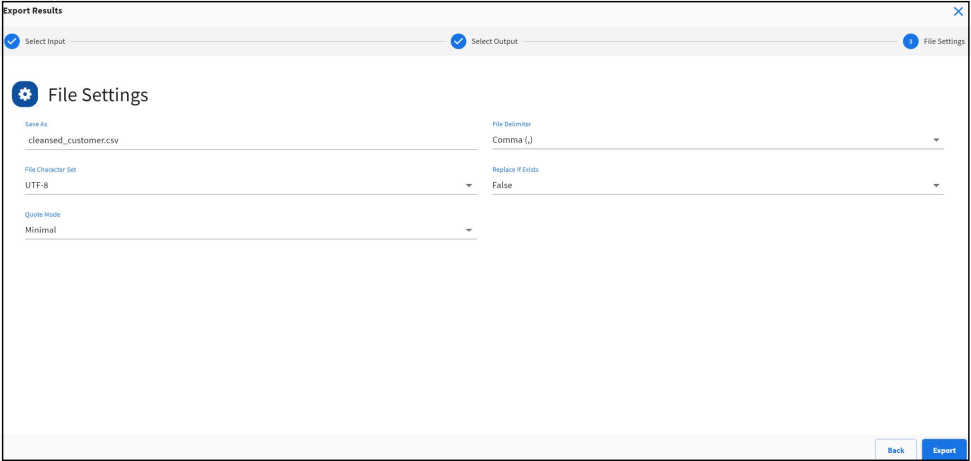
- Configure settings to
generate output file and click
Export.
Unique Record Identifier
When a user uploads a data set in iDQ, the data set may not always contain a unique record identifier for each row in the data set. By default, the system will automatically generate a new record identifier named as dq_recid that uniquely identifies each row in the input data set. This unique record identifier is persisted in the system throughout the DQ analysis process and is also available as an attribute in the Rule output data sets.
Note: It is recommended that developers use the dq_recid as the key to join input data records with the different output data records generated by executing Rules against the input data set.
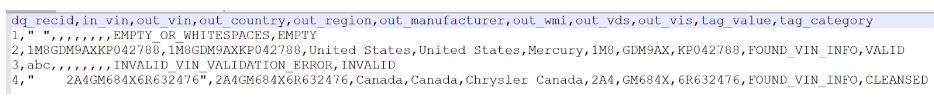
Example - if a user uploaded a new data set with 4 rows of data and one column called “in_vin”, the system will generate a unique record id for each row of data and add it to the input data set as shown below.
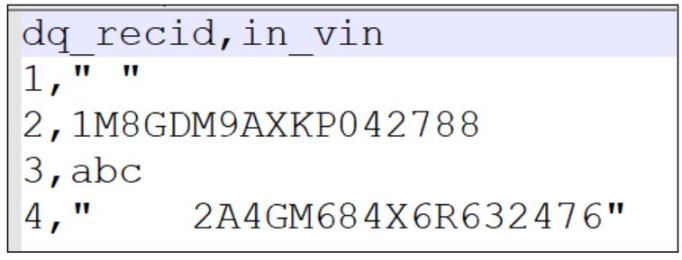
This unique record id is also available on each of the Rule results outputs. In this example, if we ran this data through a Rule to cleanse VIN numbers, the output CSV file will also have this new column dq_recid with the values mapped from the corresponding rows in the input data set.
Download All
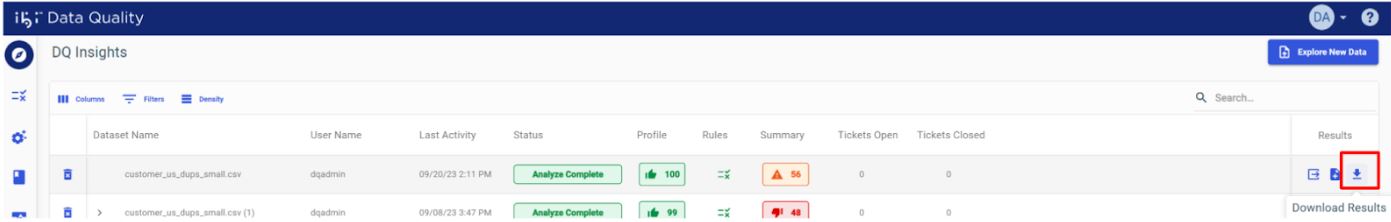
You can download the detailed results of the analysis by clicking the Download button under Results
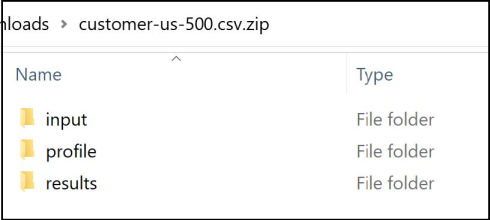
The zip file contains following folders:
- Input: Contains input data set
- Profile: Contains data profiling results
- Results: Contains DQ Analysis Results
Results output: You can download the detailed results of the analysis by clicking the Download button under:
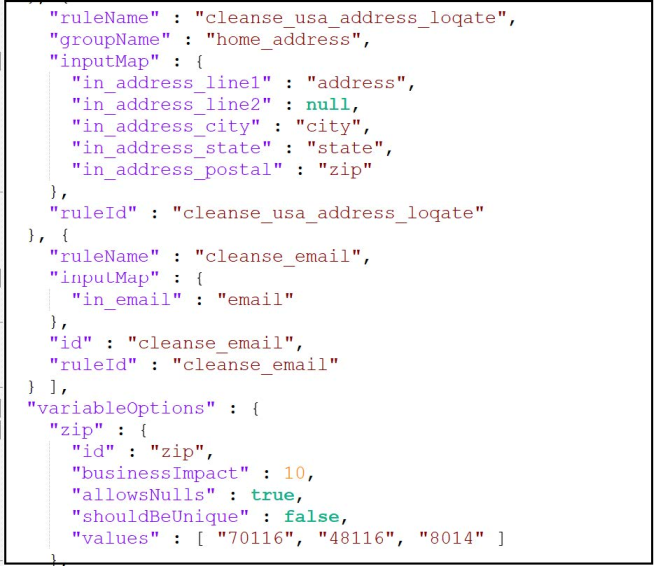
- One JSON file named rules. json with the summary of rules mapped by the user.
- One JSON file with the naming convention <<input_file_name>>.results.json with the summarized results of the rule based DQ analysis.
- One CSV File with naming convention <<input_file_name>>.cleansed.csv with the same number of columns as the input data set. This file will have multiple CSV files with the naming convention <<variable or group name>>[<<rule name>>].csv representing an output file for each combination of variable /group and the rule that is executed.
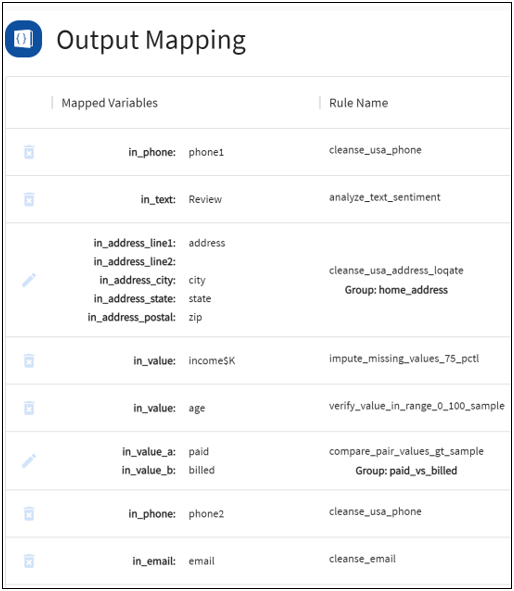
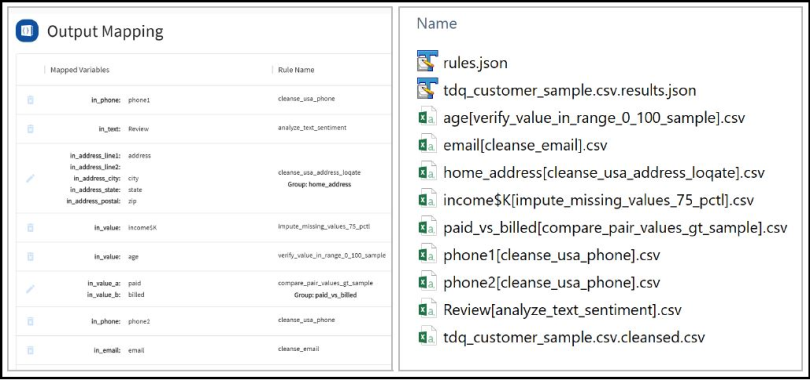
In the example shown below, a user submitted 8 rules for execution and results folder contains:
- 1 rules JSON
- 1 Summarized rule JSON
- 1 cleaned output CSV
- 8 output CSVs
1 rules.JSON: summary of the rules mapped by the user
|
Rule Name |
Name of the rule selected by the user |
|
Group Name |
Group name provided by the user for mapping multiple data attributes into a single Rule |
|
Input Map |
Mapping of input data attributes to rule inputs |
|
Variable Options |
Data expectations by the user for each
data attribute:
|
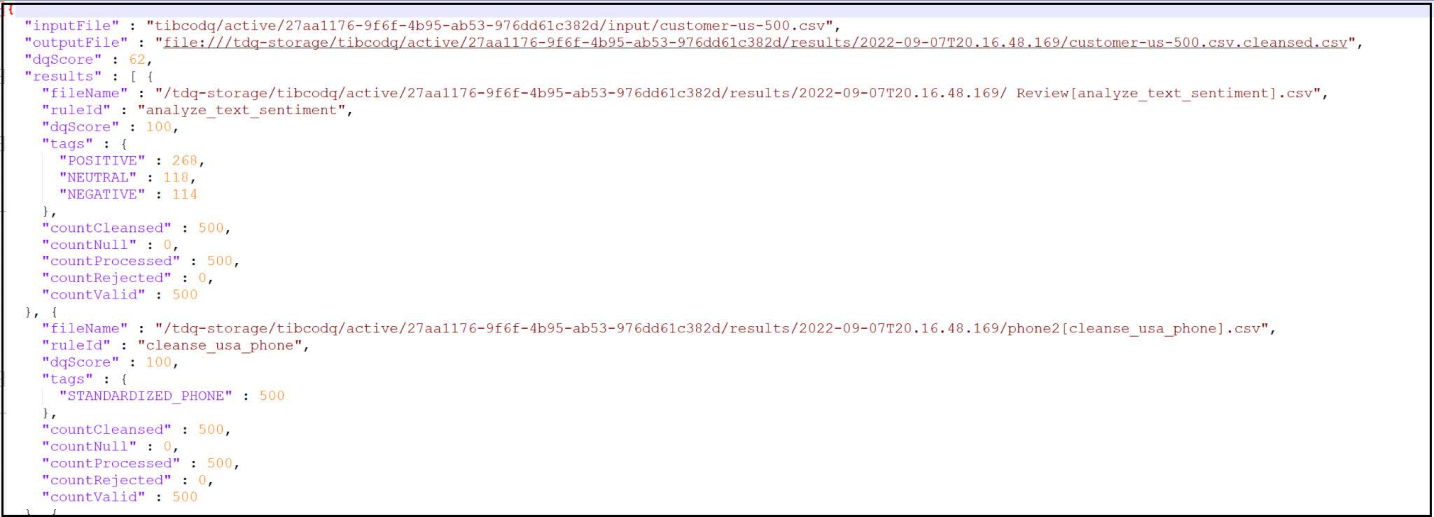
2. <<input_data_set_name>>.results.json - JSON output with summarized results of the DQ analysis
| Input File | Input file that contains the input data set uploaded by the user |
| Output File | Output file that contains cleansed output values of all the data attributes in the input data set |
| Overall DQ score | Data Quality(DQ) score for the entire data set in the range 0 to 100 (100 is the best) |
| Rule based DQ score | Data Quality(DQ) score for each data attribute in the range 0 to 100 (100 is the best) |
| Tags | List of issues or reportable facts identified during the data quality analysis. |
| Count processed | Total number of data values processed by a Rule. |
| Count Valid | Total number of valid output values generated by a Rule |
| Count invalid | Total number of values that failed validation and could not be fixed by a Rule |
| Count Missing | Total number of empty or missing values |
| Count Cleansed | Total number of cleansed output values generated by a Rule |
Export DQ Mapping
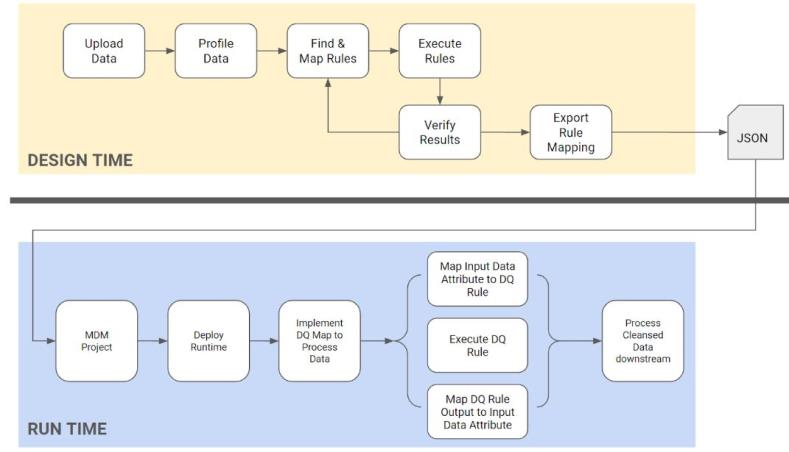
When you have successfully tested a set of DQ Rules, you may want to create a DQ mapping artifact that can be shared with client application developers.
Using this DQ mapping artifact, a programmer can develop and deploy code in a client application runtime environment to automate the process of mapping input data attributes to the DQ Rule inputs, process input data through those Rules, and map the Rule output data attributes back to input data, thereby replacing bad data with cleansed data.
To programmatically deploy DQ rules in a data flow, you will minimally need:
-
Rule Name - Name of the DQ Rule.
-
Input mapping - mapping that specifies which input data attribute values are passed as Rule inputs.
-
Output mapping - mapping that specifies which Rule output data attribute values replace input data attribute values.
-
Data Expectations (Should Be Unique, Allows Null and Business Impact) - Data expectations set by the user when they upload the data.
In order to demonstrate this feature, we are going to use a sample data set that has an attribute named email with malformed email addresses. After mapping and running that mapped to DQ Rule named cleanse_email, process the input data values for that attribute through the DQ Rule and replace invalid or malformed values with the cleansed output from that DQ Rule.
Steps:
-
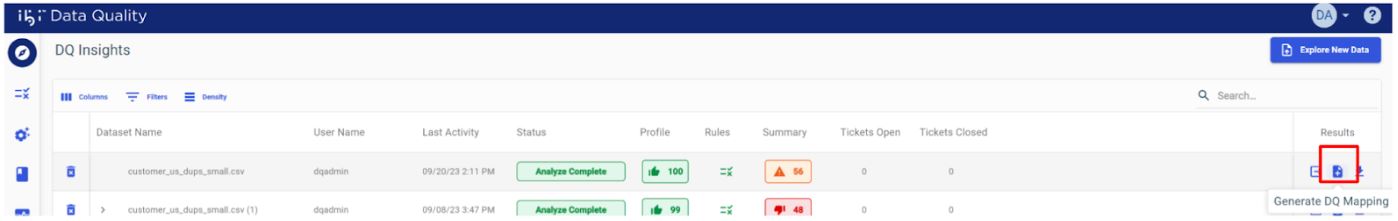
After DQ analysis, click Generate DQ Mapping.
-
On the mapping screen, click the Add map button next to the desired Rule output column and select the target column from the Right Pane.
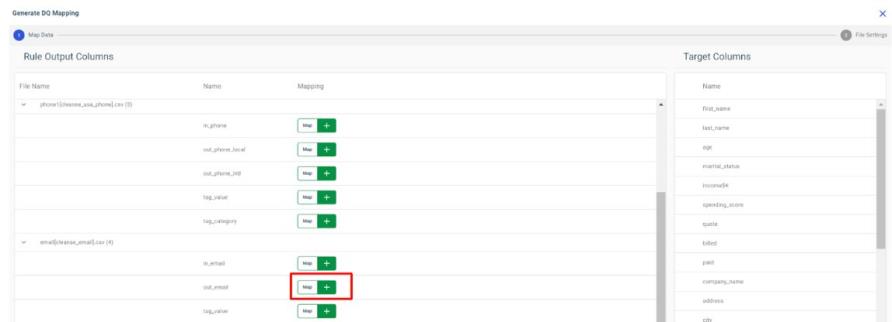
In this example, we are mapping the out_email attribute from the results of cleanse_email DQ Rule results to the email data attribute from the input data set.
-
Continue mapping all the DQ Rule result attributes to the input data attributes.
-
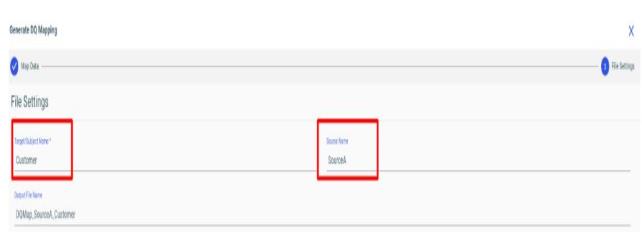
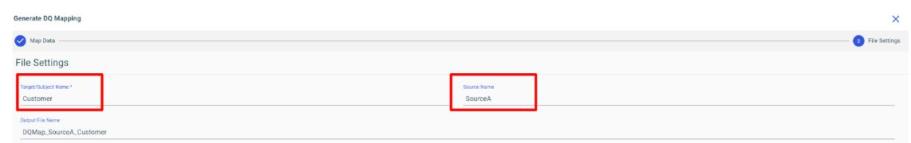
Click Next.
-
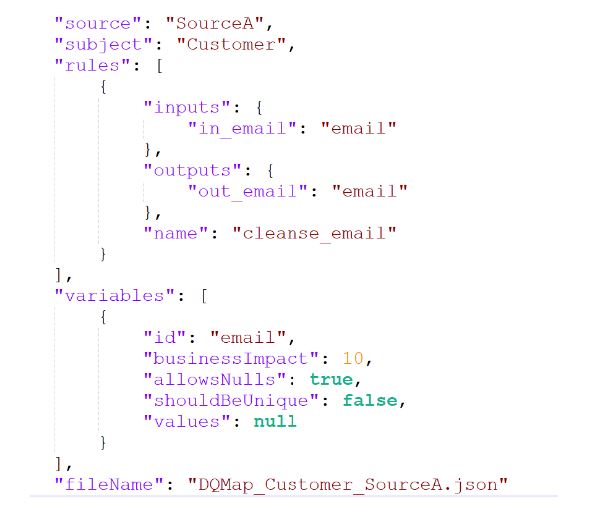
Enter the name of the Subject that represents this real world entity. This attribute is optional.
-
Enter the name of the Data Source if this mapping only applies to a specific data source, else leave it empty if it applies to all data sources.
-
When you click Export, a JSON file will be downloaded to your local machine. You can then share the DQ mapping artifact with client application developers or export and version it in an artifact repository.
Note - ibi MDM has a prebuilt feature where developers can import DQ Rule mapping artifacts into MDM (or Omni-Gen) projects and deploy the artifact into the runtime engine for cleansing master or transactional data in the system.
Rerun Analysis With Different Rules
After analyzing your data through Rules for the first time, you can re-analyze the same data with a different set of Rules, allowing you to skip the data upload and profiling steps. A new record is generated that displays at the top of the home page for each rerun.
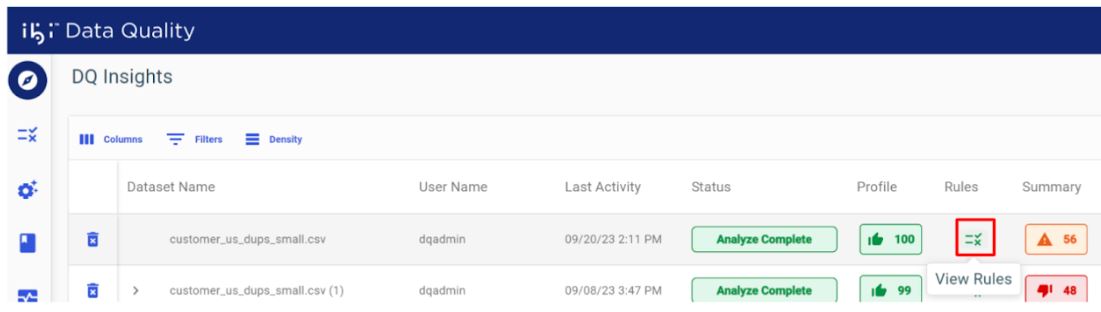
- Click
View under Rules, as shown in the following image.
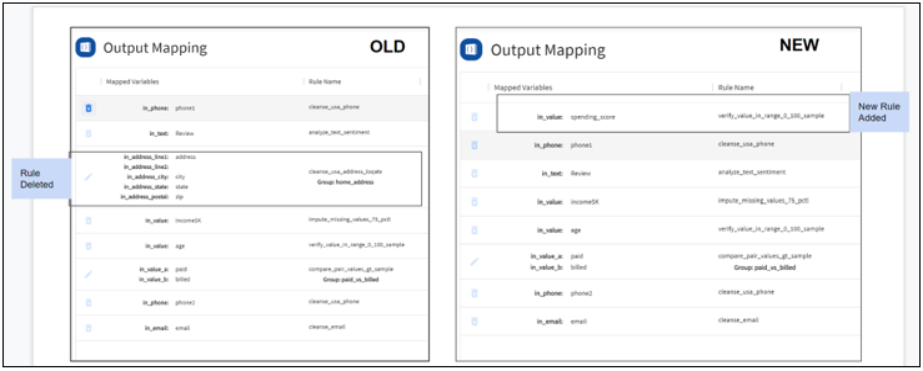
- Edit the rules by replacing
existing rules or adding new ones, as shown in the following image.
- When you submit the new
request for Rules execution, the most recent analysis will be shown at the top
of the home page. The results from different analysis runs will be grouped
together with the most recent results shown first. Click on the drop-down
button to expand and view results from previous analysis.