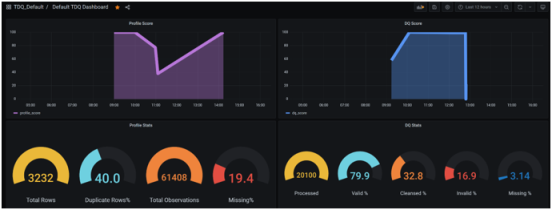
Monitoring Data Quality Metrics
The ibi Data Quality WatchDog application provides users with meaningful insights on their Data Quality (DQ) metrics. Watchdog users can create new panels and dashboards with pre-configured metrics and KPIs, setup notification channels, and create alerts for monitoring metrics against user defined thresholds.
To learn more about creating reports, dashboards, and notification channels on Grafana, see the following website:
https://grafana.com/docs/grafana/latest/whatsnew/whats-new-in-v7-5/
DQ Metrics Views
This section describes all of the DQ metric views that are accessible through the Watchdog app.
Profile Summary
View Name
watchdog_pstats_summ
Description
This view contains the summary stats and metrics generated by the Profiler for an input data set. This view will have one row for each data set profiled in ibi Data Quality.
|
Column |
Description |
|---|---|
|
id |
Unique identifier for the profile summary record. |
|
dataset_id |
Unique identifier for the input data set. |
|
created_by |
User account that executed the data profile. |
|
created_date |
Date when the data profile report is generated. |
|
source_name |
User assigned source name for the data set. |
|
source_type |
User assigned source type for the data set. |
|
app_name |
User assigned app name for the data set. |
|
industry |
User assigned industry associated with the data set. |
|
entity |
User assigned entity associated with the data set. |
|
count_variables |
Total number of data attributes in the data set. |
|
count_observations |
Total number of observations in the data set (row times column). |
|
count_rows |
Total number of rows in the data set. |
|
count_dup_rows |
Total number of duplicate rows in the data set. |
|
pct_dup_rows |
Percentage of duplicate rows in the data set. |
|
count_dedup_rows |
Total number of rows that were removed during data dedup. |
|
pct_dedup_rows |
Percentage of of rows that were removed during data dedup. |
|
count_missing |
Total number of observations that are empty, blank or nulls. |
|
pct_missing |
Percentage of observations that are empty, blank or nulls. |
|
profile_score |
Profile score of the data set calculated using the profiling stats and user’s expectations of the data. |
Profile Details
View Name
watchdog_pstats_dtl
Description
This view contains the detailed stats and metrics generated by the Profiler for an input data set. This view will have one row for each data attribute in the data set that is profiled in ibi Data Quality.
|
Column |
Description |
|---|---|
|
id |
Unique identifier for the profile detail record. |
|
pstats_summ_id |
Unique identifier for the profile summary record. |
|
dataset_id |
Unique identifier for the input data set. |
|
created_by |
User account that executed the data profile. |
|
created_date |
Date when the data profile report is generated. |
|
source_name |
User assigned source name for the data set. |
|
source_type |
User assigned source type for the data set. |
|
app_name |
User assigned app name for the data set. |
|
industry |
User assigned industry associated with the data set. |
|
entity |
User assigned entity associated with the data set. |
|
variable_name |
Name of the data attribute. |
|
type |
Data type of the attribute. |
|
content_type |
Data class of the attribute. |
|
sensitive_flag |
True if the data attribute is classified a Sensitive data, otherwise False. |
|
expect_nulls |
User assigned value set to True if values in the data attribute can be NULL. |
|
expect_unique |
User assigned value set to True if values in the data attribute is expected to be unique. |
|
business_impact |
User assigned value set to HIGH, MEDIUM, or LOW indicating business impact of the data attribute. |
|
profile_score |
Profile score of the data attribute calculated using the profiling stats and user’s expectations of the data. |
|
count_total |
Total number of observations for the data attribute. |
|
count_unique |
Total number of unique observations for the data attribute. |
|
count_non_unique |
Total number of non-unique observations for the data attribute. |
|
count_distinct |
Total number of distinct observations for the data attribute. |
|
count_blanks |
Total number of blank values or empty strings in the data attribute. |
|
count_nulls |
Total number of NULL values in the data attribute. |
|
count_not_nulls |
Total number of non-NULL values in the data attribute. |
|
length_min |
Minimum character length for the values in the data attribute. |
|
length_max |
Maximum character length for the values in the data attribute. |
|
length_avg |
Average character length for the values in the data attribute. |
|
length_median |
Median character length for the values in the data attribute. |
|
most_common_pattern |
Most common pattern for the values in the data attribute. |
|
count_pattern |
Total count of the values with the most common pattern in the data attribute. |
|
pct_pattern |
Percentage of the values with the most common pattern in the data attribute. |
|
most_common_mask |
Most common mask for the values in the data attribute. |
|
count_mask |
Total count of the values with the most common mask in the data attribute. |
|
pct_mask |
Percentage of the values with the most common mask in the data attribute. |
|
num_avg |
Average value calculated from all the numeric values in the data attribute. |
|
num_min |
Minimum value calculated from all the numeric values in the data attribute. |
|
num_max |
Maximum value calculated from all the numeric values in the data attribute. |
|
num_std_dev |
Standard deviation value calculated from all the numeric values in the data attribute. |
|
num_pctl_25 |
25th percentile value calculated from all the numeric values in the data attribute. |
|
num_pctl_50 |
50th percentile value calculated from all the numeric values in the data attribute. |
|
num_pctl_75 |
75th percentile value calculated from all the numeric values in the data attribute. |
DQ Summary
View Name
watchdog_dqstats_summ
Description
This view contains the summary stats and metrics generated by executing Rules against an input data set. This view will have one row for each set of Rules analyzed against an input data set in ibi Data Quality.
|
Column |
Description |
|---|---|
|
dq_summ_id |
Unique identifier for the data quality summary record. |
|
input_name |
Unique identifier for the input data set. |
|
created_by |
User account that executed the Rules against the input data set. |
|
created_date |
Date when the data quality report is generated. |
|
source_name |
User assigned source name for the data set. |
|
source_type |
User assigned source type for the data set. |
|
app_name |
User assigned app name for the data set. |
|
industry |
User assigned industry associated with the data set. |
|
entity |
User assigned entity associated with the data set. |
|
count_processed |
Total number of observations processed. |
|
count_invalid |
Total number of observations that failed validation and could not be fixed. |
|
count_valid |
Total number of observations that contain valid output values. |
|
count_cleansed |
Total number of observations that were fixed - standardized, normalized, or enriched, number of cleansed observations are also counted under number of valid observations. |
|
count_missing |
Total number of observations that are empty or missing. |
|
pct_valid |
Percentage of total observations that failed validation and could not be fixed. |
|
pct_invalid |
Percentage of total observations that contain valid output values. |
|
pct_cleansed |
Percentage of total observations that were fixed - standardized, normalized, or enriched, number of cleansed observations are also counted under number of valid observations. |
|
pct_missing |
Percentage of total observations that are empty or missing. |
|
dq_score |
Data quality score of the input data set calculated using the data quality stats and user’s expectations of the data. |
DQ Details
View Name
watchdog_dqstats_dtl
Description
This view contains the detailed stats and metrics generated by executing Rules against an input data set. This view will have one row for each Rule executed against an input data set in ibi Data Quality.
|
Column |
Description |
|---|---|
|
dq_dtl_id |
Unique identifier for the data quality analysis detail record. |
|
dq_summ_id |
Unique identifier for the data quality summary record. |
|
variable_group_name |
Name of the data attribute or group of data attributes analyzed by a Rule. |
|
input_name |
Name of the data set. |
|
created_by |
User account that executed the Rules against the input data set. |
|
created_date |
Date when the data quality report is generated. |
|
source_name |
User assigned source name for the data set. |
|
source_type |
User assigned source type for the data set. |
|
app_name |
User assigned app name for the data set. |
|
industry |
User assigned industry associated with the data set. |
|
entity |
User assigned entity associated with the data set. |
|
rule_id |
Unique identifier of the Rule. |
|
count_processed |
Total number of observations processed. |
|
count_invalid |
Total number of observations that failed validation and could not be fixed. |
|
count_valid |
Total number of observations that contain valid output values. |
|
count_cleansed |
Total number of observations that were fixed - standardized, normalized, or enriched, number of cleansed observations are also counted under number of valid observations. |
|
count_missing |
Total number of observations that are empty or missing. |
|
dq_score |
Data quality score of the data attribute or group of data attributes calculated using the data quality stats and user’s expectations of the data. |
DQ Transaction Summary
View Name
watchdog_dqstats_summ
Description
This view contains the summary stats and metrics generated by executing Rules against an input data set. This view will have one row for each set of Rules analyzed against an input data set in ibi Data Quality.
|
Column |
Description |
|---|---|
|
dq_summ_id |
Unique identifier for the data quality summary record. |
|
input_name |
Unique identifier for the input data set. |
|
created_by |
User account that executed the Rules against the input data set. |
|
created_date |
Date when the data quality report is generated. |
|
source_name |
User assigned source name for the data set. |
|
source_type |
User assigned source type for the data set. |
|
app_name |
User assigned app name for the data set. |
|
industry |
User assigned industry associated with the data set. |
|
entity |
User assigned entity associated with the data set. |
|
count_processed |
Total number of observations processed. |
|
count_invalid |
Total number of observations that failed validation and could not be fixed. |
|
count_valid |
Total number of observations that contain valid output values. |
|
count_cleansed |
Total number of observations that were fixed - standardized, normalized, or enriched, number of cleansed observations are also counted under number of valid observations. |
|
count_missing |
Total number of observations that are empty or missing. |
|
pct_valid |
Percentage of total observations that failed validation and could not be fixed. |
|
pct_invalid |
Percentage of total observations that contain valid output values. |
|
pct_cleansed |
Percentage of total observations that were fixed - standardized, normalized, or enriched, number of cleansed observations are also counted under number of valid observations. |
|
pct_missing |
Percentage of total observations that are empty or missing. |
|
dq_score |
Data quality score of the input data set calculated using the data quality stats and user’s expectations of the data. |