Overview of Monitor
Monitor supports continuous real-time monitoring of the activity and health of your TIBCO® Data Virtualization(TDV) instances and clusters using an Internet browser. Access Manager from Monitor to get more information about the specific TDV instances you are monitoring.
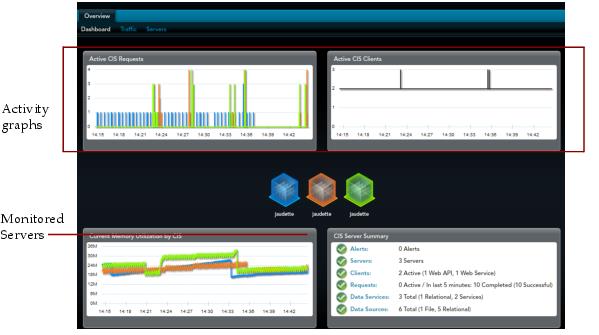
Activity Graphs
Three activity graphs each allow you to select one of 32 graph types to display the information you want to monitor. Every server in the cluster is represented in each graph. The lines are color-coded so that you can easily differentiate between servers.
Monitored Servers
An icon for each of the monitored servers is displayed in a different color to help match the server activity and health with the server. Hovering your cursor over a server displays details about that server. You can display activity and health for one of the monitored servers or for all servers.
TDV Server Summary Panel
The panel on the lower right summarizes the status of the TDV instances being monitored including the number of recent alerts, the number of servers being monitored, the number of active clients, and so on.