Graph Type | Description |
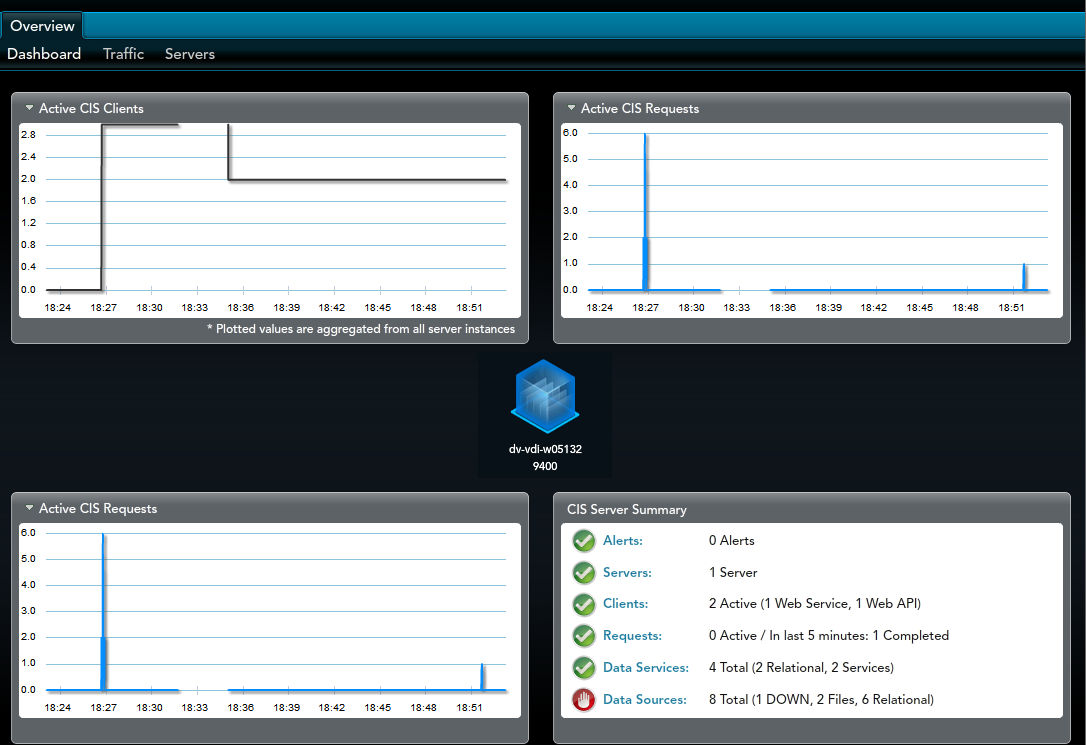
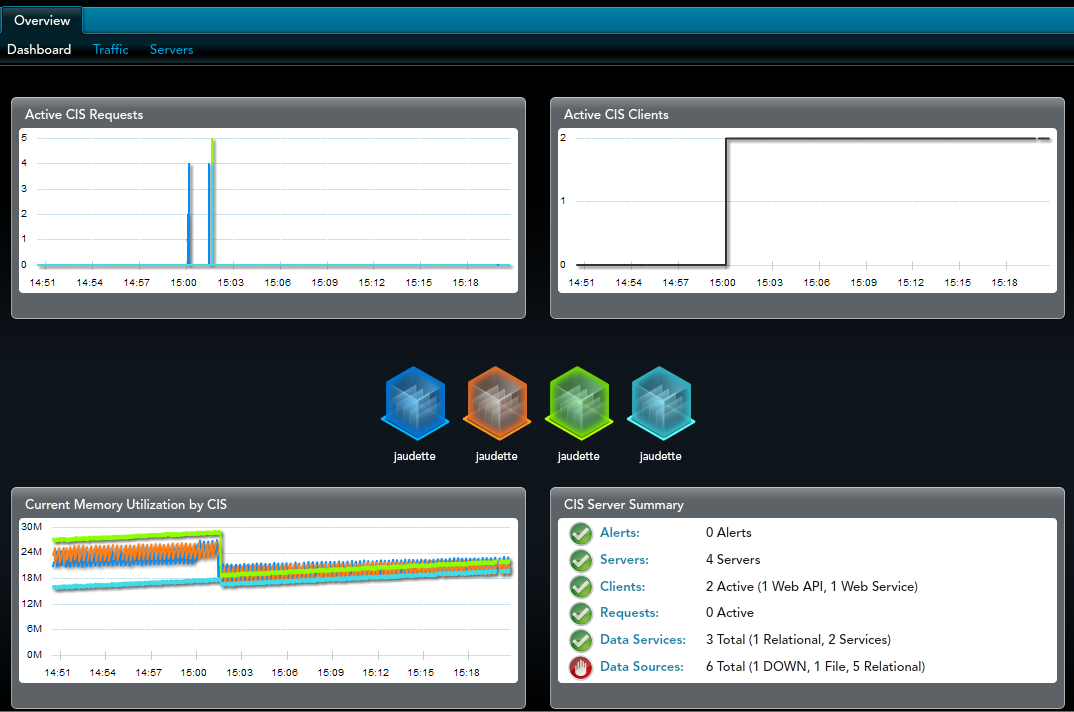
Active TDV Clients | The Monitor Active TDV Clients graph displays the current number of active TDV clients for the TDV instances being monitored. A TDV client consists of aggregated sessions where the host, client type, user name, and domain name match. The Y-axis shows the number of active clients for each time period. |
Active TDV Requests | The Monitor Active TDV Requests graph displays the current number of TDV client requests per second (default; interval can be changed) for each TDV client being monitored. A TDV client consists of a connection where the host, client type, user name, and domain name match. The Y-axis shows the number of active TDV client requests for each time interval. The pop-up window identifies the client host and port number, and tells the number of requests at the time point where the cursor is hovering. |
Active Data Source Request Count | The Monitor Active Data Source Requests Count graph displays the number of data source requests per second (default; interval can be changed) for each TDV being monitored. A TDV client consists of a connection where the host, client type, user name, and domain name match. The Y-axis shows the number of data source requests for each time interval. The pop-up window identifies the client host and port number, and tells the number of requests at the time point where the cursor is hovering. |
Active Request Count | The Monitor Active Request Count graph displays the number of requests per second (default; interval can be changed) for each TDV being monitored. A TDV client consists of a connection where the host, client type, user name, and domain name match. The Y-axis shows the number of data source requests for each time interval. The pop-up window identifies the client host and port number, and tells the number of requests at the time point where the cursor is hovering. |
Active Session Count | The Monitor Active Session Count graph displays the number of session per second (by default) for each TDV being monitored. A TDV client consists of a connection where the host, client type, user name, and domain name match. The Y-axis shows the number of active sessions for each time interval. The pop-up window identifies the client host and port number and tells the number of requests at the time point where the cursor is hovering. |
Available Managed Memory | The Monitor Available Managed Memory graph displays the amount of managed memory that is available per second (default; interval can be changed) for each TDV being monitored. A TDV client consists of a connection where the host, client type, user name, and domain name match. The Y-axis shows the amount of available managed memory, in bytes, for each time interval. The pop-up window identifies the client host and port number and tells the number of requests at the time point where the cursor is hovering. |
Current Managed Memory Usage | The Monitor Current Managed Memory Usage graph displays the amount of managed memory used per second (default; interval can be changed) for each TDV being monitored. A TDV client consists of a connection where the host, client type, user name, and domain name match. The Y-axis shows the amount of managed memory, in bytes, used for each time interval. The pop-up window identifies the client host and port number and tells the number of requests at the time point where the cursor is hovering. |
Current Memory Usage by TDV | The Monitor Current Memory Utilization graph displays the amount of memory being used by the Java virtual machine for each TDV instance. The Y-axis shows the amount of memory used, in megabytes, for each time interval. The pop-up window tells the amount of memory being used at the time point where the cursor is hovering. |
Percentage of Memory to Manage | The Monitor Percentage of Memory to Manage graph displays the percentage of memory to manage by the Java virtual machine for each TDV instance. The pop-up window tells the percentage of memory being used at the time point where the cursor is hovering. |
Privilege Cache Access Count | The Monitor Privilege Cache Access Count graph displays the number of times the cache was accessed by the Java virtual machine for each TDV instance. The Y-axis shows the number of times the cache was accessed for each TDV instance during each time interval. The pop-up window tells the amount of memory being used at the time point where the cursor is hovering. |
Privilege Cache Hit Count | The Monitor Privilege Cache Hit Count graph displays the number of times the cache was hit by the Java virtual machine for each TDV instance. The Y-axis shows the number of cache hits by the Java virtual machine for each TDV instance during each time interval. The pop-up window tells the amount of memory being used at the time point where the cursor is hovering. |
Privilege Cache Max Size | The Monitor Privilege Cache Max Size graph displays the maximum size of the cache for each TDV instance. The Y-axis shows the size of the cache, in entries, by TDV instance and time interval. The pop-up window tells the amount of memory being used at the time point where the cursor is hovering. |
Privilege Cache Size | The Monitor Privilege Cache Size graph displays the size of the cache for each TDV instance. The Y-axis shows the size of the privilege cache, in entries, by TDV instance and time interval. The pop-up window tells the amount of memory being used at the time point where the cursor is hovering. |
Resource Cache Access Count | The Monitor Resource Cache Access Count graph displays the number of times the resource cache was accessed by the Java virtual machine for each TDV instance. The Y-axis shows the number of times the resource cache was accessed for each time interval. The pop-up window tells the amount of memory being used at the time point where the cursor is hovering. |
Resource Cache Hit Count | The Monitor Resource Cache Hit Count graph displays the number of times the resource cache was hit by the Java virtual machine for each TDV instance. The Y-axis shows the number of resource cache hits for each TDV instance and time interval. The pop-up window tells the amount of memory being used at the time point where the cursor is hovering. |
Resource Cache Max Size | The Monitor Resource Cache Max Size graph displays the maximum size of the resource cache for each TDV instance. The Y-axis shows the size of the resource cache, in entries, for each TDV instance and time interval. The pop-up window tells the amount of memory being used at the time point where the cursor is hovering. |
Resource Cache Size | The Monitor Resource Cache Size graph displays the size of the resource cache for each TDV instance. The Y-axis shows the size of the resource cache, in entries, for each TDV instance and time interval. The pop-up window tells the amount of memory being used at the time point where the cursor is hovering. |
Total Data Source Request Count | The Monitor Total Data Source Request Count graph displays the total number of data source requests for each TDV instance. The Y-axis shows the number of data source requests for each TDV instance and time interval. The pop-up window tells the amount of memory being used at the time point where the cursor is hovering. |
Total Request Count | The Monitor Total Data Source Request Count graph displays the total number of requests for each TDV instance. The Y-axis shows the number of requests for each TDV instance and time interval. The pop-up window tells the amount of memory being used at the time point where the cursor is hovering. |
Total Session Count | The Monitor Total Session Count graph displays the total number of sessions for each TDV instance. The Y-axis shows the number of sessions for each TDV instance and time interval. The pop-up window tells the amount of memory being used at the time point where the cursor is hovering. |
Total Transaction Count | The Monitor Total Transaction Count graph displays the total number of transactions for each TDV instance. The Y-axis shows the number of transactions for each TDV instance and time interval. The pop-up window tells the amount of memory being used at the time point where the cursor is hovering. |
Total Trigger Count | The Monitor Total Trigger Count graph displays the total number of triggers that fired for each TDV instance. The Y-axis shows the number of triggers that fired for each TDV instance and time interval. The pop-up window tells the amount of memory being used at the time point where the cursor is hovering. |
Total Trigger Failures | The Monitor Total Trigger Failures graph displays the total number of triggers that failed for each TDV instance. The Y-axis shows the number of triggers that failed for each TDV instance and time interval. The pop-up window tells the amount of memory being used at the time point where the cursor is hovering. |
Transactions Active Count | The Monitor Transactions Active Count graph displays the total number of active transactions for each TDV instance. The Y-axis shows the number of active transactions for each TDV instance and time interval. The pop-up window tells the amount of memory being used at the time point where the cursor is hovering. |
Transactions Failed During Commit Count | The Monitor Transactions Failed During Commit Count graph displays the number of transactions that failed during commit for each TDV instance. The Y-axis shows the number of transactions that failed during commit for each TDV instance and time interval. The pop-up window tells the amount of memory being used at the time point where the cursor is hovering. |
Transactions Rolled Back Count | The Monitor Transactions Rolled Back Count graph displays the number of transactions that rolled back for each TDV instance. The Y-axis shows the number of transactions that rolled back for each TDV instance and time interval. The pop-up window tells the amount of memory being used at the time point where the cursor is hovering. |
Unmanaged (Reserved) Memory | The Monitor Unmanaged (Reserved) Memory graph displays the amount of unmanaged reserved memory for each TDV instance. The Y-axis shows the amount of unmanaged reserved memory, in bytes, for each TDV instance and time interval. The pop-up window tells the amount of memory being used at the time point where the cursor is hovering. |
User Cache Access Count | The Monitor User Cache Access Count graph displays the number of times the user cache was accessed by the Java virtual machine for each TDV instance. The Y-axis shows the number of user cache accesses for each TDV instance and time interval. The pop-up window tells the amount of memory being used at the time point where the cursor is hovering. |
User Cache Hit Count | The Monitor User Cache Hit Count graph displays the number of times the user cache was hit by the Java virtual machine for each TDV instance. The Y-axis shows the number of user cache hits by for each TDV instance and time interval. The pop-up window tells the amount of memory being used at the time point where the cursor is hovering. |
User Cache Max Size | The Monitor User Cache Max Size graph displays the maximum size of the user cache for each TDV instance. The Y-axis shows the maximum size of the user cache for each TDV instance and time interval. The pop-up window tells the amount of memory being used at the time point where the cursor is hovering. |
User Cache Size | The Monitor User Cache Size graph displays the size of the user cache for each TDV instance. The Y-axis shows the user cache size, in bytes, for each TDV instance and time interval. The pop-up window tells the amount of memory being used at the time point where the cursor is hovering. |
Waiting Request Count | The Monitor Waiting Request Count graph displays the number of waiting requests for each TDV instance. The Y-axis shows the number of waiting requests for each TDV instance and time interval. The pop-up window tells the amount of memory being used at the time point where the cursor is hovering. |